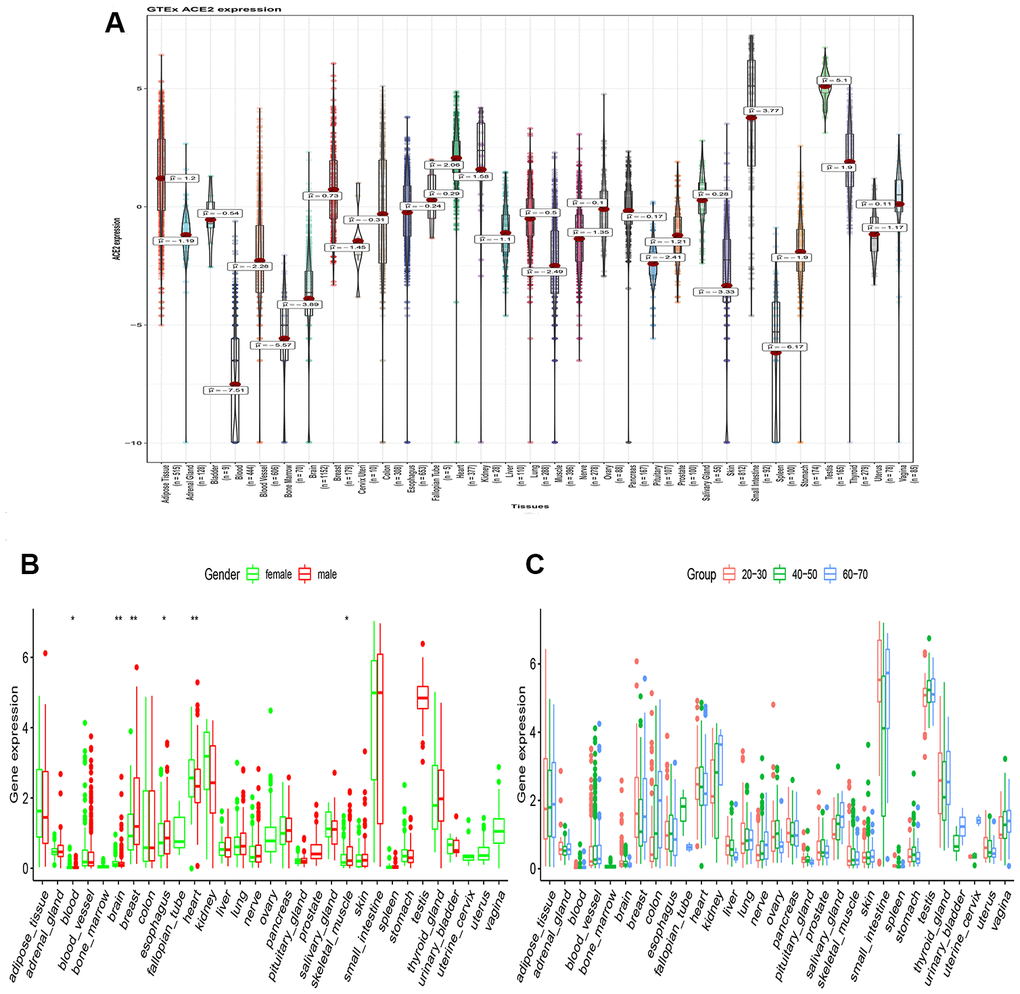
Figure 1.RNA-seq analysis of public GTEx datasets. (A) Violin plot of ACE2 expression in normal tissues, colored by organs, Kruskal–Wallis test was used to examine the difference across organs; (B) Box plot of ACE2 expression exhibits the gender disparity across different organs using Wilcox test; (C) Box plot of ACE2 expression exhibits the difference in different age populations using Kruskal–Wallis test. All P value less than 0.05 was considered statistically significant.