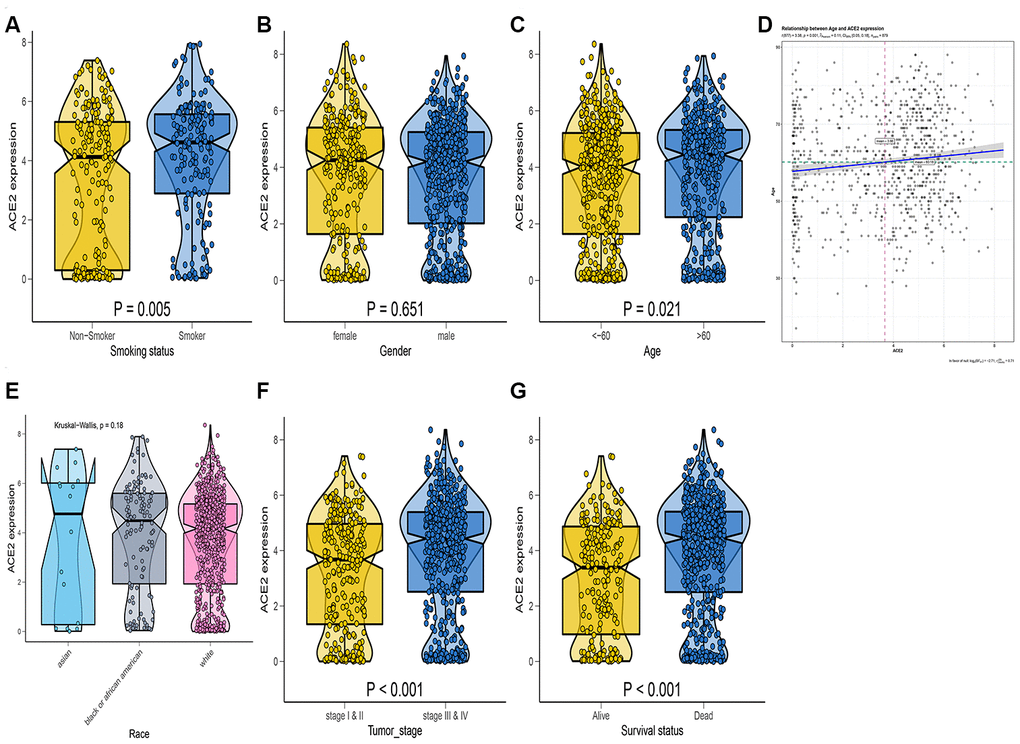
Figure 5.RNA-seq analysis of public TCGA datasets. Box-Violin plot shown the disparities of smoking status (A), gender (B), age (C), race (E), tumor stage (F), and survival probability (G). Two-tailed statistical P values were calculated by Wilcox test. (D) The association between age and ACE2 expression level.