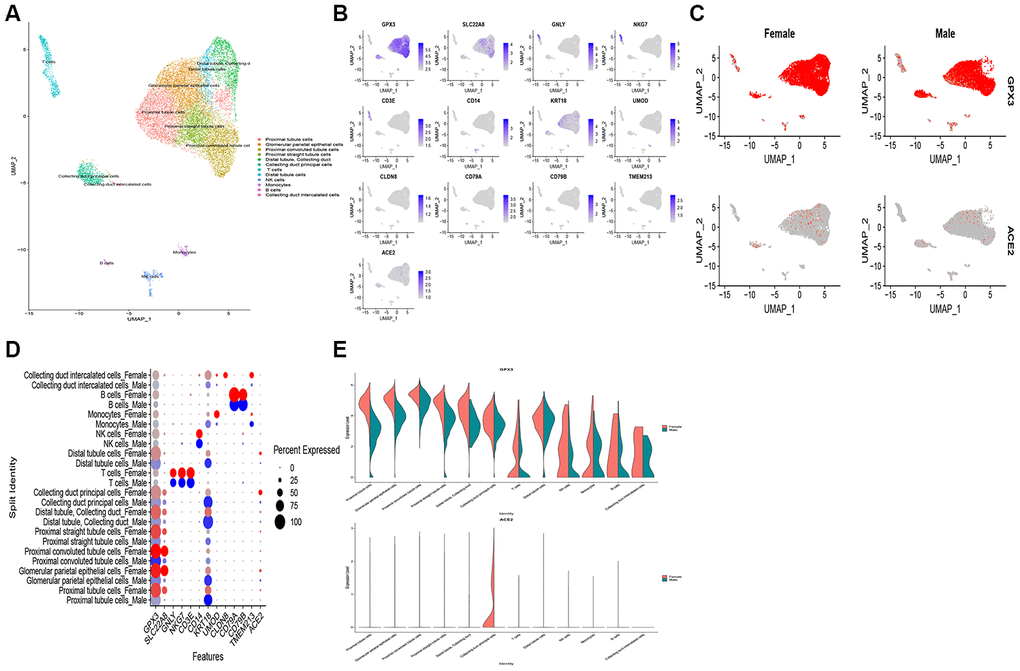
Figure 6.Single-cell RNA-seq analysis of healthy kidney tissues in humans from publicly dataset. (A) Twelve-cell types were identified by the cell markers, cells were clustered by the UMAP method; (B) Scatter plots of all the cells with ACE2 and other gene expressions; The scatter plot (C), dot plot (D) and violin plot (E) exhibits the disparities of ACE2 expression in gender.