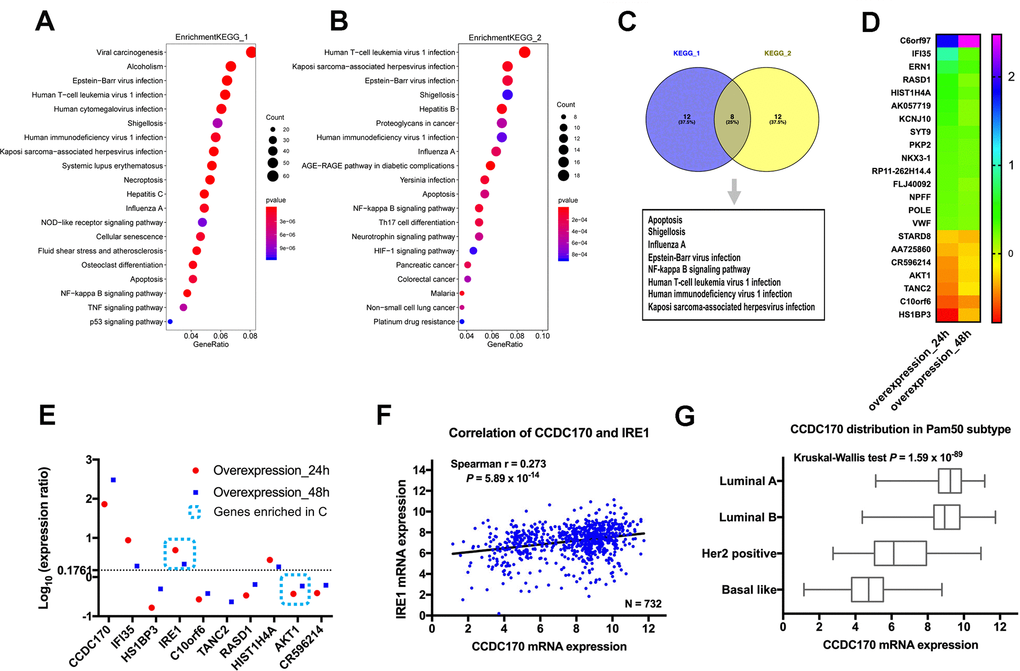
Figure 1.The influence of CCDC170 on the gene expression profile of MCF7 cells. The top 20 significantly enriched pathways in 24-hour group (A) and 48-hour group (B) of CCDC170 upregulation in MCF7 breast cancer cells. Gene Ratio represented the ratio of the DEGs number to the total gene number in a certain pathway. The color of the P values indicated the significance of the Gene Ratio. The size of the circle indicated the number of the target genes involved in a certain pathway. (C) The eight overlapping enriched pathways both in 24-hour group and 48-hour group of CCDC170 overexpression. (D) The top 20 DEGs with consistent expression-change tendencies in the 24-hour and 48-hour groups. (E) The expression ratio of the top 10 DEGs with consistent expression-change tendencies in the 24-hour and 48-hour groups. Only IRE1 and AKT1 were involved in the eight overlapping pathways, and the change of IRE1 expression was the most obvious. (F) Positive correlation between CCDC170 and IRE1 levels (r = 0.273, P = 5.89×10⁻¹⁴). (G) The differential distribution of CCDC170 expression in Pam50 subtypes (P = 1.59×10-89). KEGG, Kyoto Encyclopedia of Genes and Genomes. DEGs, differentially expressed genes. Datasets from TCGA were implemented for the correlation and distribution analysis.