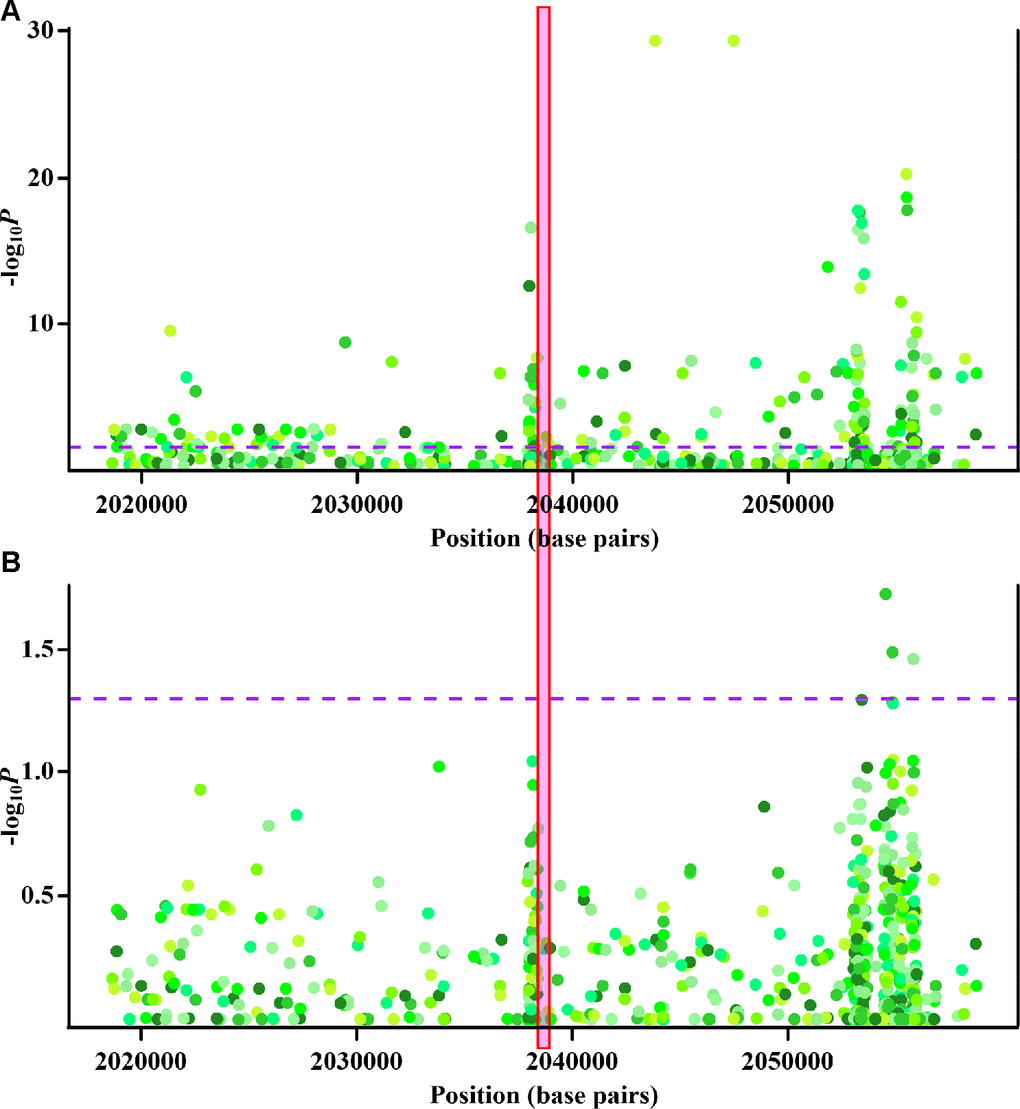
Figure 3.Cis-methyl-quantitative trait locus (cis-meQTL) and genetic analysis of cg22626579. (A) Regional association plots of monocyte-specific associations between nearby genetic variants and cg22626579 methylation. X-axis represents positions on respective chromosome. Y axis represents minus log10P of monocyte-specific associations between genetic variants and cg22626579 methylation. (B) Regional association plots of monocyte-specific associations between nearby genetic variants and gout. X-axis represents positions on respective chromosome. Y axis represents minus log10P of monocyte-specific associations between genetic variants and gout. Every point is one genetic variant colored with respective hue, with different colors implying different genetic variants. The dashed purple lines indicate the significance threshold (P = 0.05), and the red box highlights the location of cg22626579. Monocyte-specific associations of genetic variants with cg22626579 methylation and gout are analysed using multiple regression analysis, adjusting for sex, age, alcohol drinking, smoking status, smoking history (total pack-years) and cell fractions (see supplementary methods).