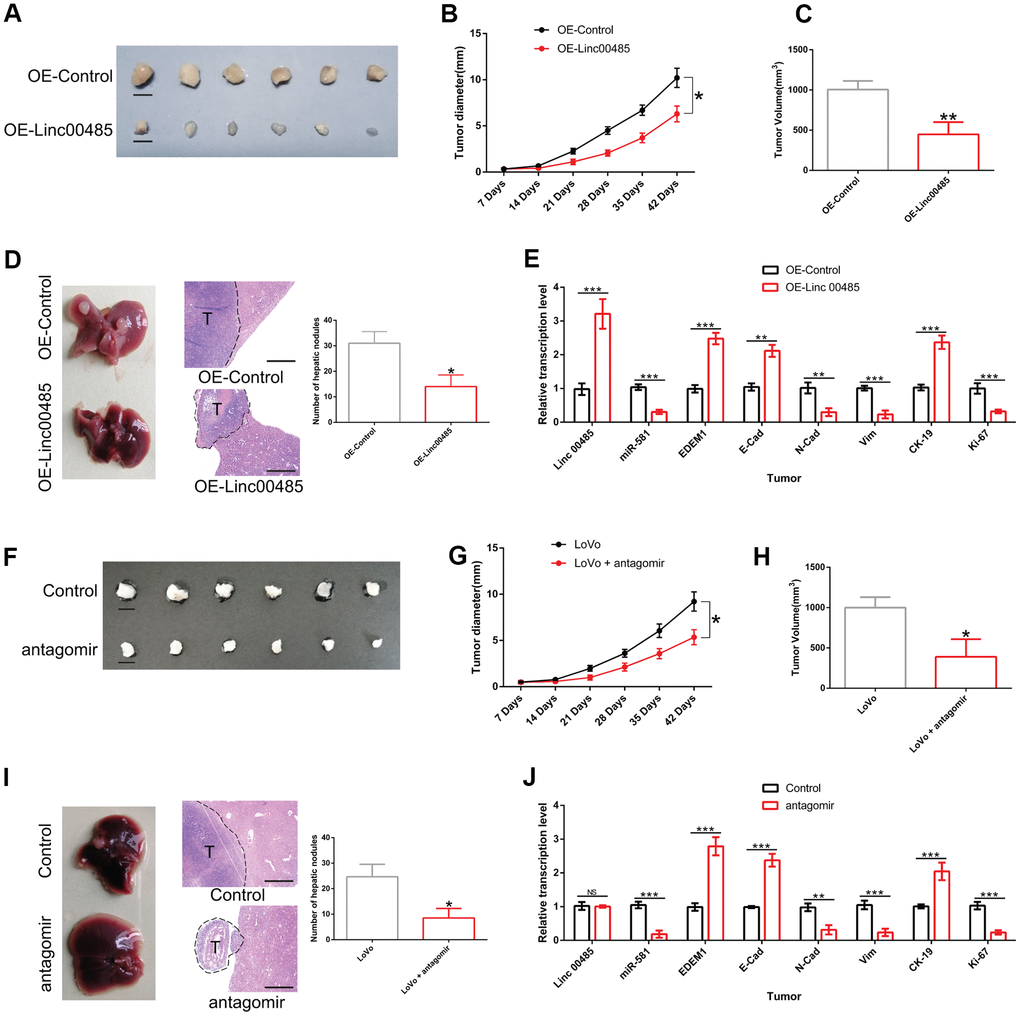
Figure 8.The effects of LINC00485 overexpression and miR-581 knockdown on CRC cell growth and liver metastasis in vivo. (A) Representative images of tumors derived from LINC00485-overexpressed LoVo cells at day 42 after subcutaneous injection (n=6 per group). (B) Tumor diameter was measured weekly after subcutaneous of injection LINC0048-overexpressed LoVo cells into the dorsal side of nude mice (n=6 per group). (C) Tumor volume of CRC tissues derived from LINC00485-overexpressed LoVo cells detected at day 42. (D) The number of hepatic nodules were counted in paraffin sections of liver at day 28 after injection with LINC00485-overexpressed LoVo cells into the spleen of the mice (n=6 per group). (E) The mRNA expression levels of LINC00485, miR-581, EDEM1, cytokeratin, E-cadherin, N-cadherin, and vimentin in hepatic nodules following injection of LINC00485-overexpressed LoVo cells into the spleen of the mice (n=6 per group). (F) Representative images of tumors derived from LoVo cells at day 42. Nude mice bearing xenograft tumors received miR-581 antagomir once a week (n=6 per group). (G) Tumor diameter in LoVo-bearing nude mice with administration of miR-581 antagomir once a week (n=6 per group). (H) Tumor volume of LoVo-bearing nude mice with administration of miR-581 antagomir was evaluated at day 42. (I) The number of hepatic nodules in a CRC liver metastases mouse model at day 28 after injection of LoVo cells into the spleen of the mice (n=6 in each group). Mice received miR-581 antagomir once a week for 4 weeks. (J) The mRNA expression levels of LINC00485, miR-581, EDEM1, cytokeratin, E-cadherin, N-cadherin, vimentin and Ki-67 in hepatic nodules in a CRC liver metastases mouse model at day 28 after injection of LoVo cells into the spleen of the mice (n=6 in each group). Then, the mice received miR-581 antagomir once a week for 4 weeks. Data were analyzed using student’s t-test. Bars were represented as S.D. *P<0.05; **P<0.01; ***P<0.001. OE, overexpression.