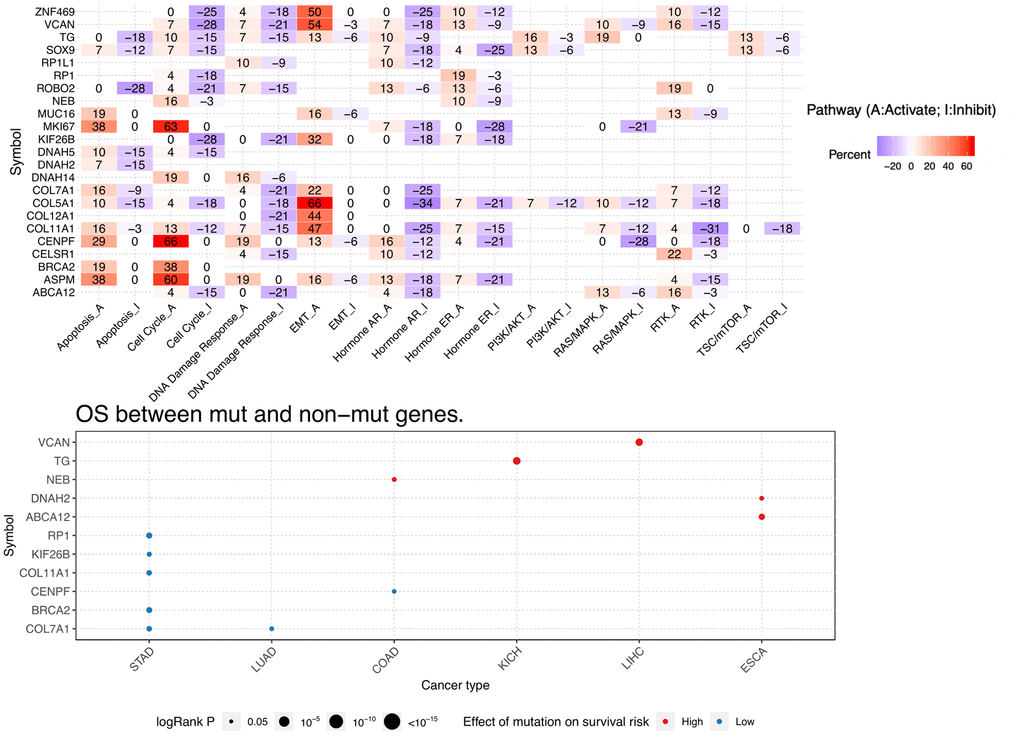
Figure 12.Pathway activity and mutation survival analysis. Top: Inferred activity of the identified host genes in biological pathways. Red and blue represent percent activation or inhibition. Bottom: Relationship between mutations in identified DEGs and survival prognosis for selected cancers.