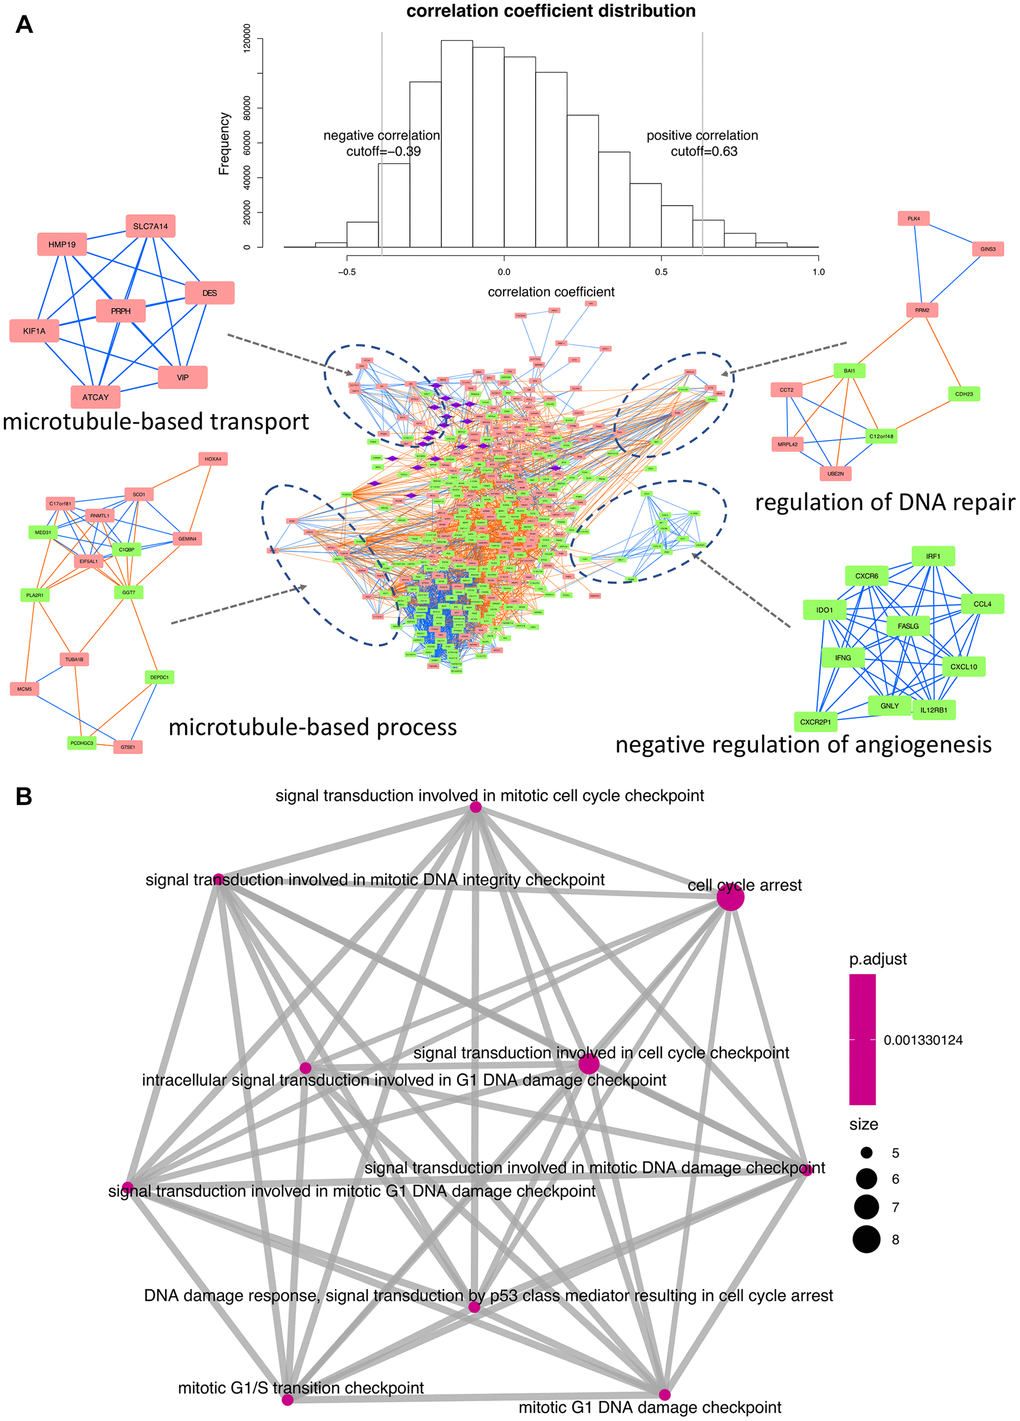
Figure 5.Interaction network and functional enrichment analysis of DEGs and miRNAs between early and late stage. (A) Co-expression network analysis. Purple diamonds represent miRNAs; red and green rectangles represent upregulated and downregulated DEGs, respectively. Orange and blue lines indicate, respectively, positive and negative correlations between nodes. Top-enriched functions are indicated under the corresponding modules. (B) Functional network depicting DEG-enriched processes regulated by the 19 differentially expressed miRNAs.