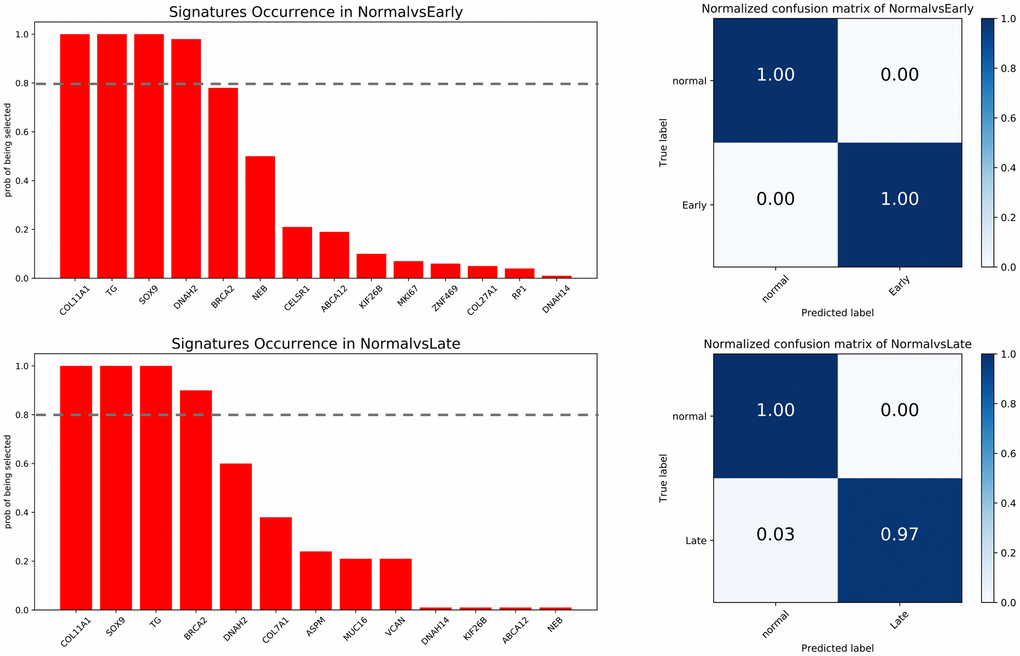
Figure 9.Feature selection and confusion matrices. Top: normal vs early stage. Bottom: normal vs late stage. The x-axis of barplot graphs lists featured genes and the y-axis indicates how many times each feature is selected over 100 permutations. The grey dash line represents the significance cutoff (0.8). The x-axis in the confusion matrices represents the predicted labels and the y-axis represents the true labels.