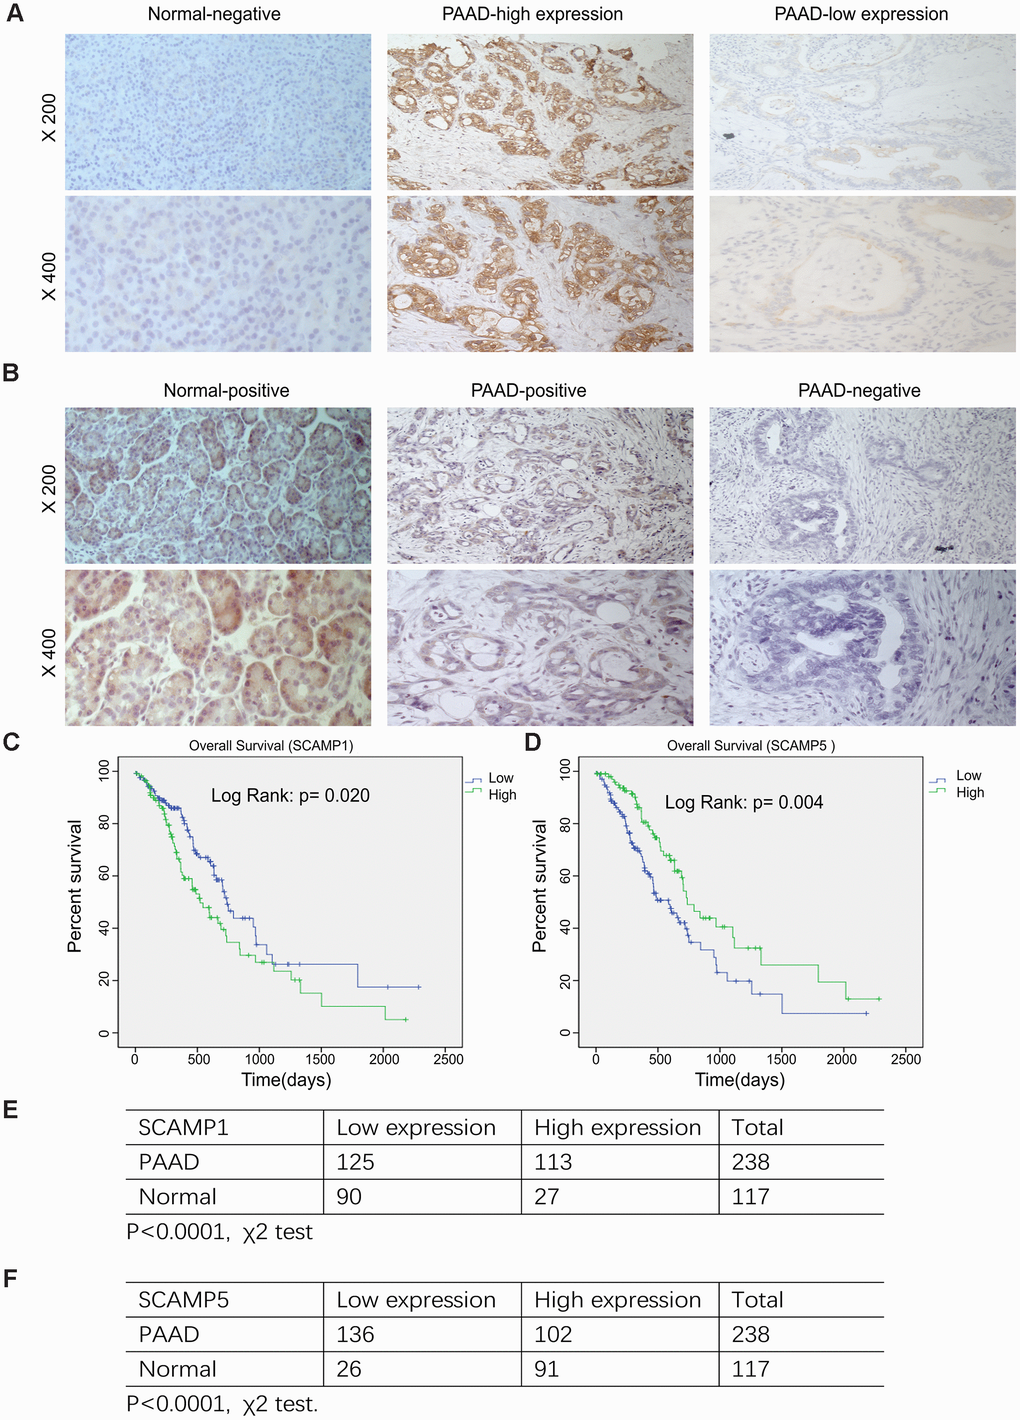
Figure 4.Relationship SCAMP1, 5 expression and the clinicopathological parameters of PAAD patients. (A, B) Representative images of SCAMP1 and SCAMP5 staining in PAAD tissue. (Expression of SCAMP1 and SCAMP5 were evaluated semi-quantitatively based on staining intensity and cell positivity, representative images are shown at × 200 and × 400 magnification, respectively.) (C, D) Kaplan–Meier analysis of the overall survival of PAAD patients stratified by the SCAMP1 and SCAMP5 immunoreactive scores by SPSS version 19.0. Log-rank test were performed to compare differences between groups. (E, F) Quantification of SCAMP1, 5 expression in pancreatic cancer and adjacent normal samples. Statistical analyses were performed using the χ2 test. Low: low expression, High: high expression.