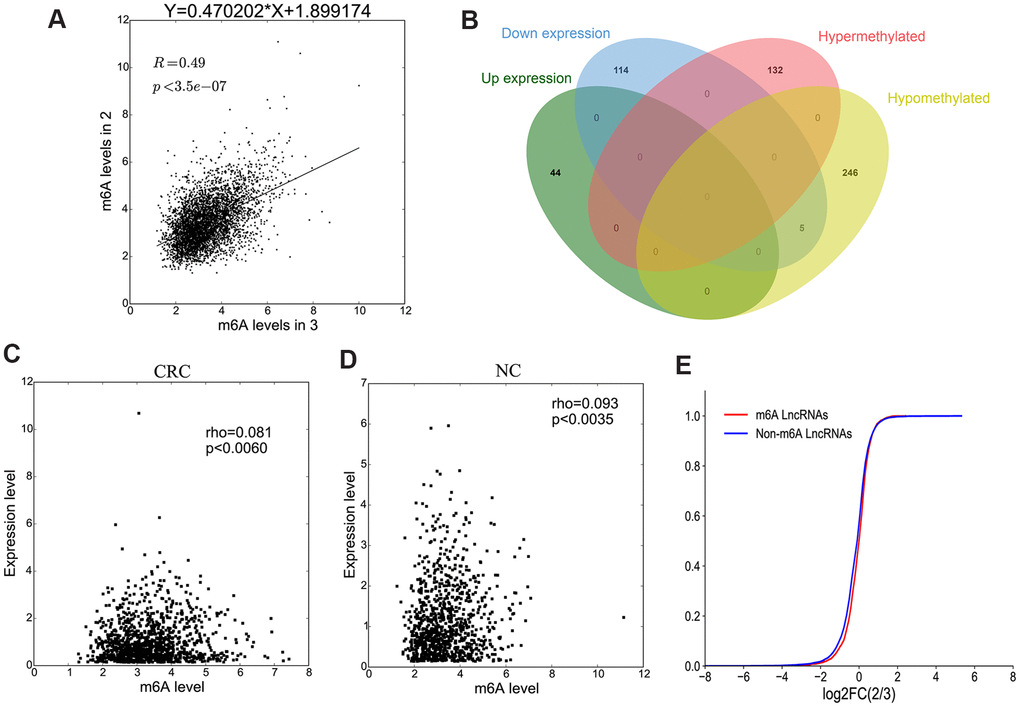
Figure 6.The association between lncRNA M6A methylation and expression. (A) The scatter plot shows the correlation of lncRNA M6A methylation between in CRC and NC. (B) Venn diagram showing the relationship between M6A modification and expression. (C, D) The scatter plot shows the correlation between lncRNA M6A methylation level and expression level in CRC and NC. (E) The lncRNA cumulative curve.