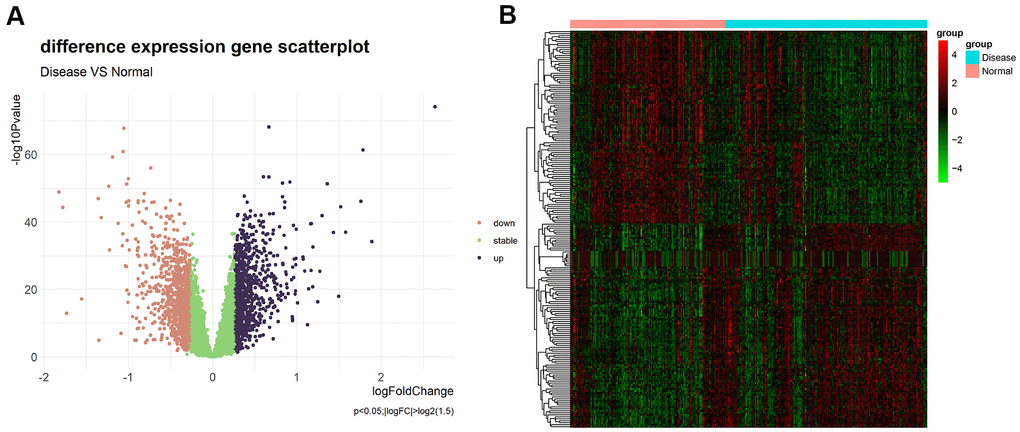
Figure 2.(A) Volcano plot of differential expression analysis results. The abscissa is logFC and the ordinate is –log10 P value. The upper right part has a P value less than 0.01 and a fold change greater than 1.5, indicating significant DEGs with higher expression levels. The upper left part has a P value less than 0.01 and a fold change less than −1.5, indicating significant DEGs with reduced expression. The green dots represent the remaining stable genes. (B) Heatmap of DEGs. The colors in the graph from red to green indicate high to low expression. On the upper part of the heatmap, the red band indicates the disease samples and the blue band indicates the normal samples.