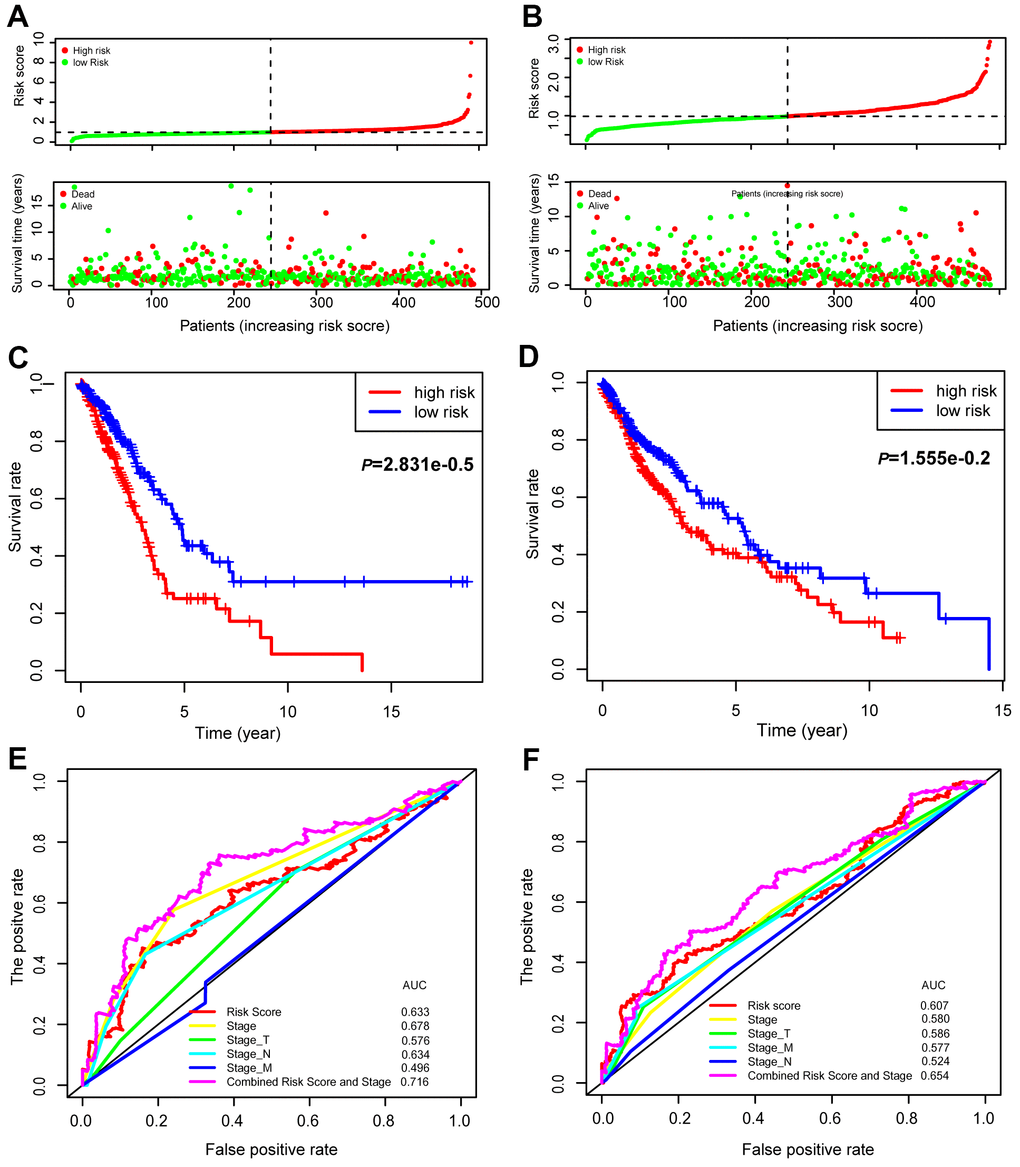
Figure 7.Prognostic values of the 15-gene signature in the TCGA lung cancer patients. The distribution of risk scores and survival statuses of patients in the LUAD (A) and LUSC cohorts (B). Kaplan-Meier survival curves of patients defined by low and high risk scores in LUAD (C) and LUSC (D). ROC curves with different characteristics of patients, as indicated in LUAD (E) and LUSC (F).