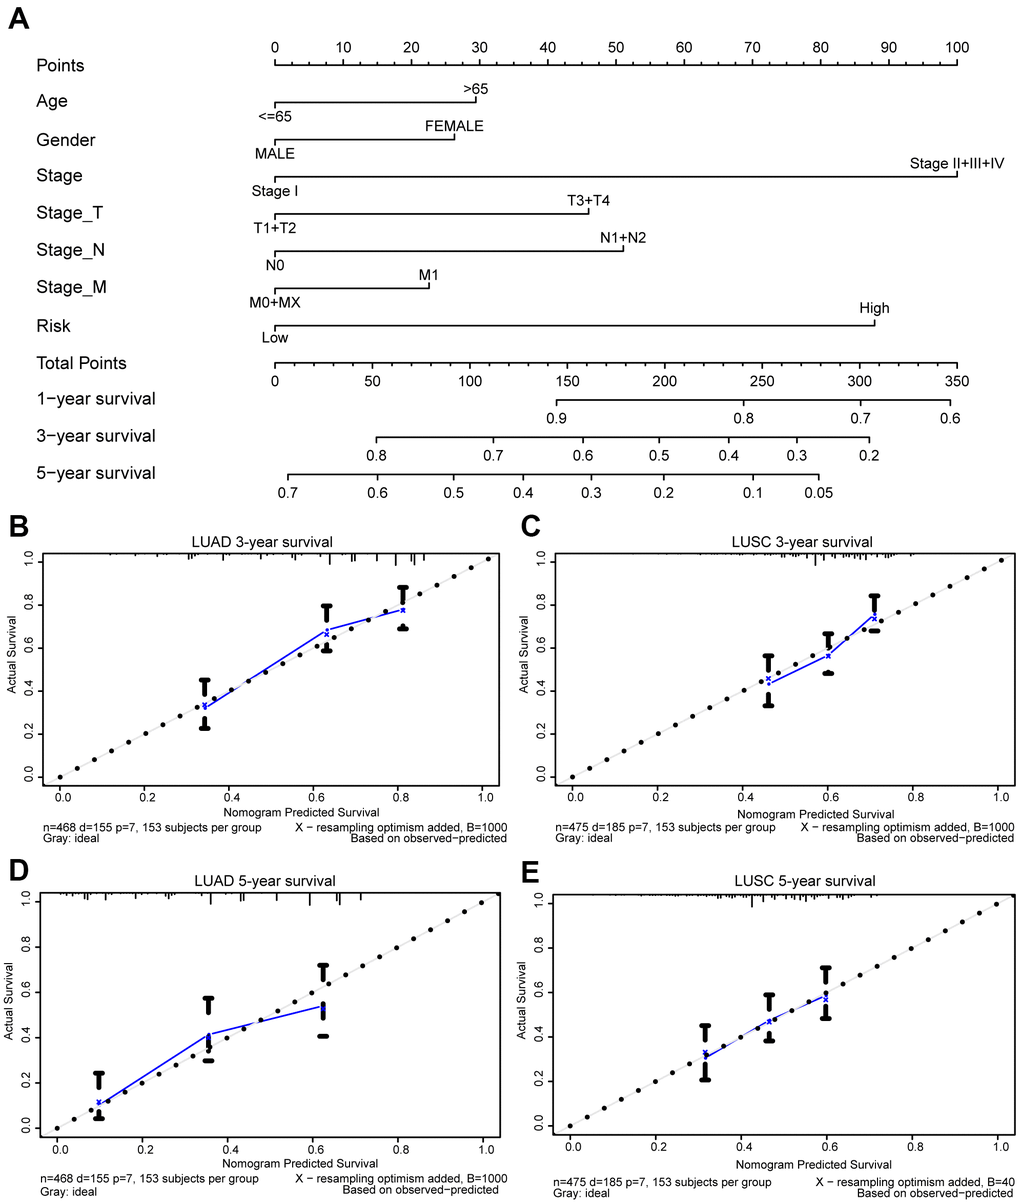
Figure 9.Prognostic nomogram for TCGA lung cancer cohorts. Nomogram for evaluating the survival probability of TCGA-LUAD patients (A). The calibration curves for predicting patient survival in TCGA-LUAD (B, D) and TCGA-LUSC (C, E). Overall survival (OS) derived from the nomogram is plotted on the x-axis, and actual OS is displayed on the y-axis. A plot approaching the 45° dashed line would show an ideal calibration model indicating the perfect concordance between the predicted probabilities and the actual survival.