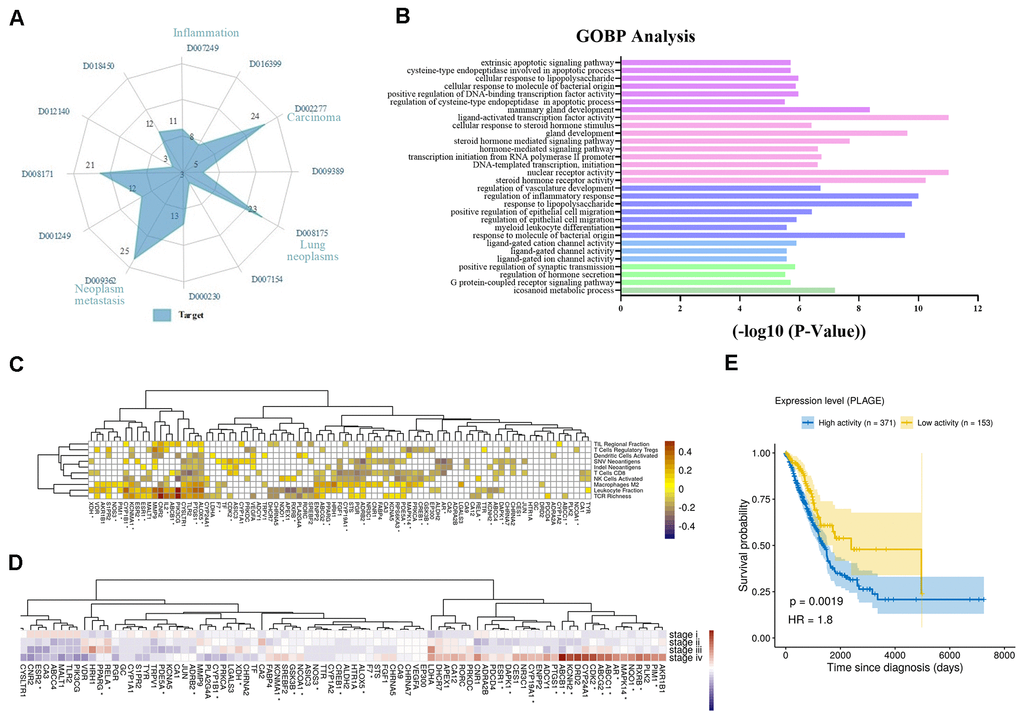
Figure 2.Analysis of multi-target of polypharmacology molecules of Epimedium treatment of NSCLC. (A) In an equi-angular spokes radar chart, each spoke represents a class of diseases, and the length of the spokes is the distribution data, which is proportional to the quantity of target proteins relative to the homologous disease. (B) The y-axis shows significantly enriched ‘Biological Process’ categories in GO of the target genes, and the x-axis shows the enrichment scores of these terms (P-value < 0.05). A specific color represents a class of biological processes. (C) The heatmap of Pearson correlation coefficients (PCCs) between gene expression level of Epimedium targets and immune phenotypes. The Benjamini-Hochberg (BH) adjusted p-values of PCCs <0.05 were shown as white color. Note that the genes labeled with an asterisk represents the targets for ICT. (D) Average expression of Epimedium targets among clinical staging (stages I–IV) in TCGA LUDA patients. For each gene, the expression was normalized by z-score transformation. Note that the genes labeled with an asterisk represents the targets for ICT. (E) Prognostic value of the Epimedium targets for overall survival of human LUAD patients comparing high and low activity. X-axis shows time for survival (days) and y-axis shows the probability of survival, where 1.0 corresponds to 100 percent.