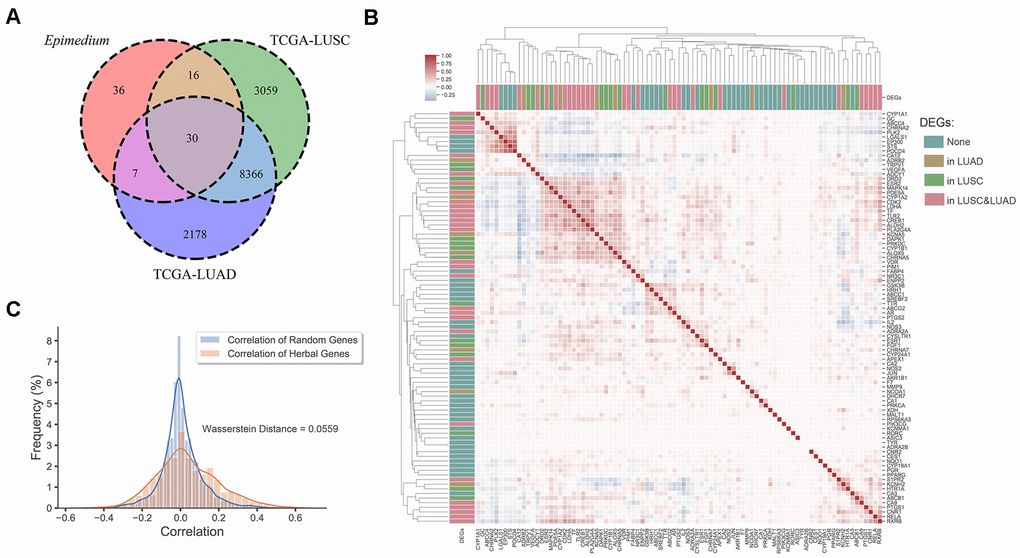
Figure 3.Differentially expression gene analysis. (A) Venn diagram of overlap genes in potential targets of Epimedium active ingredients and DEGs of LUSC and LUAD. Each region represents the number of genes. (B) Heatmap of the pairwise correlation of 89 potential genes of Epimedium active components. (C) Distribution diagram of random intergenic correlations and Epimedium intergenic correlation. Yellow indicates the correlation between the genes of Epimedium, and blue indicates the correlation between random genes (LUSC and LUAD).