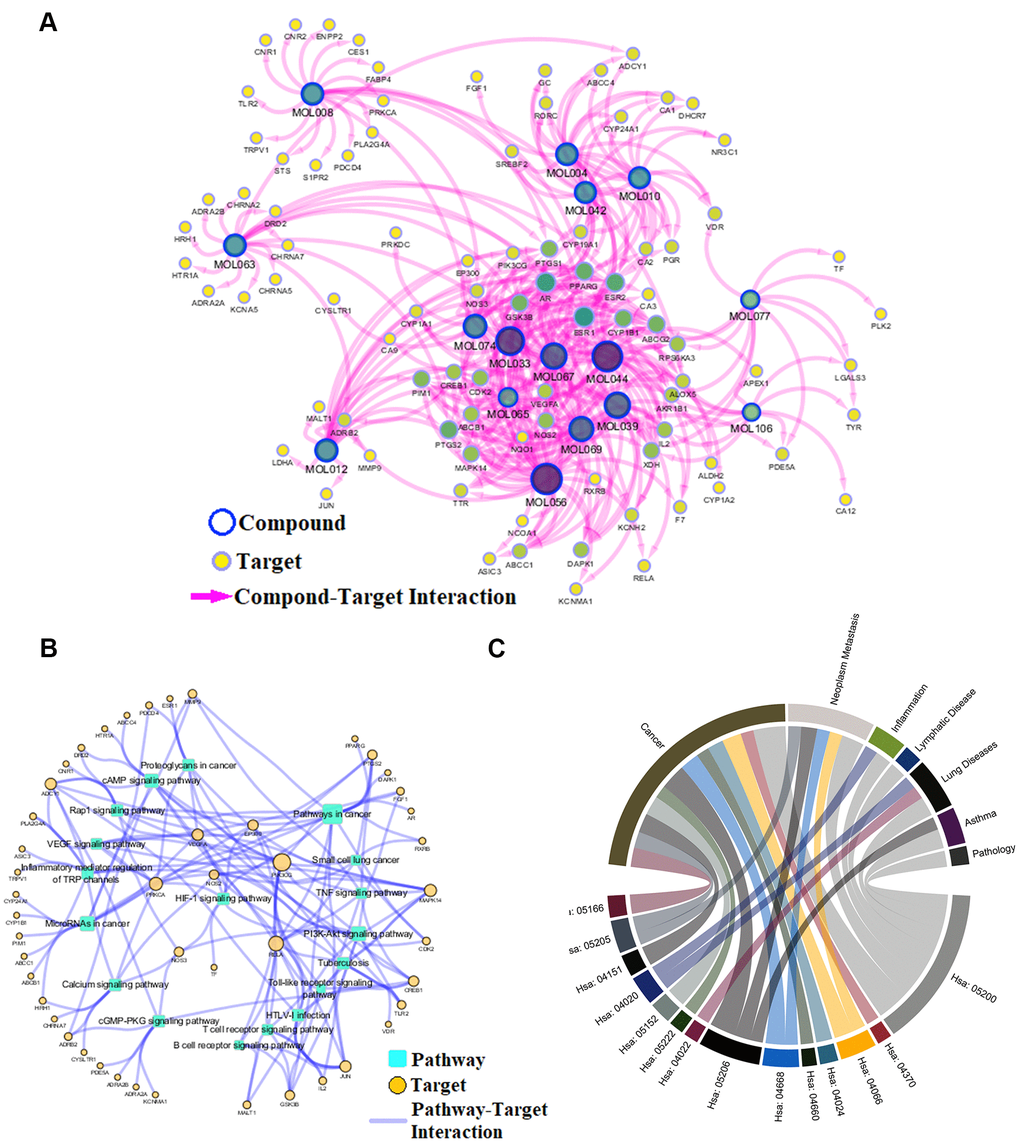
Figure 4.Network analysis. (A) C-T network. (B) T-P network. Yellow nodes represent potential targets; blue circles represent active ingredients of Epimedium; squares represent targets-related pathways; and edge represents the interaction between them. Node size is proportional to its degree. (C) P-D chord diagram. The circle represents the selected pathways and diseases, and the color of the bands within the circle reflects the relationship between the pathways and the diseases.