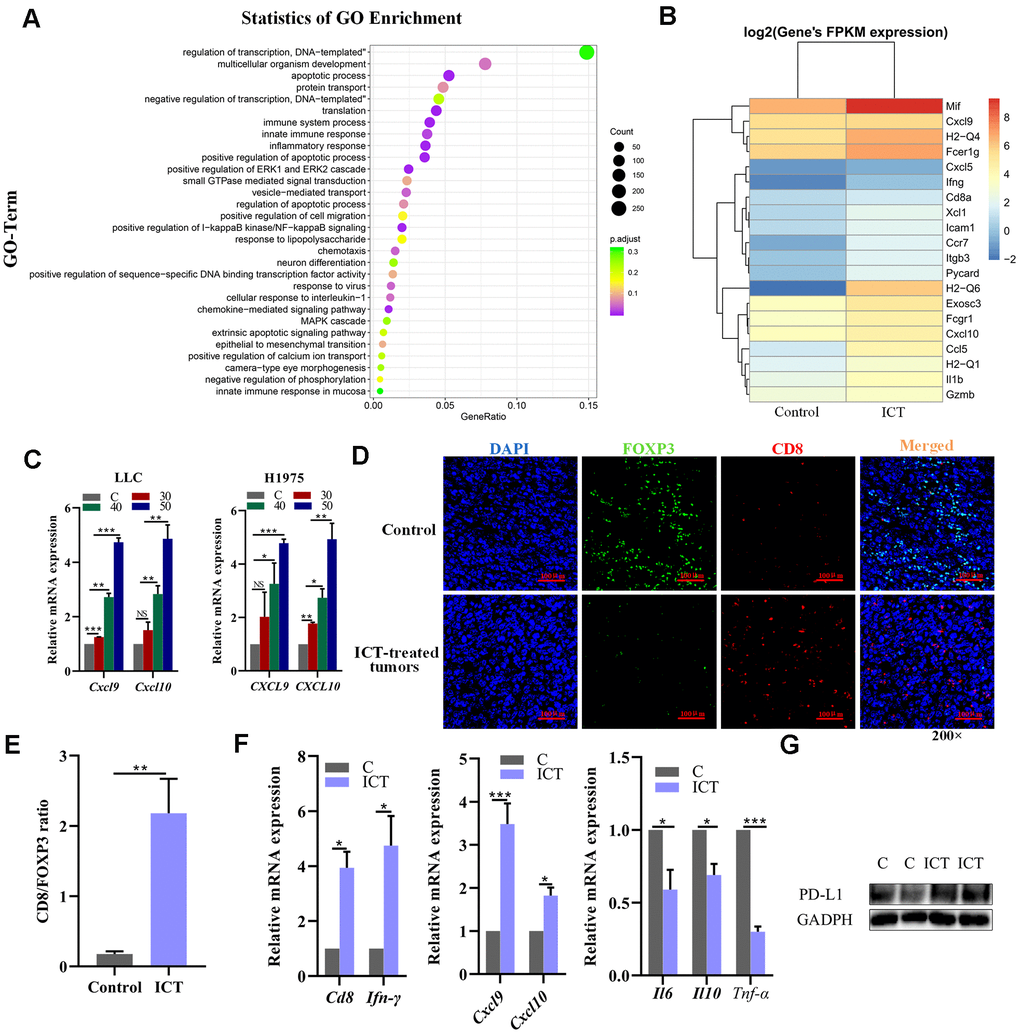
Figure 7.Analysis of increased CD8+ T cell infiltration in ICT-treated tumors. (A) GO enrichment analysis of differential genes between ICT-treated tumors and control group by ggplot2. The color represents the different adjusted P-values < 0.05, while the size of the circle represents the count. GeneRatio indicates the number of differential genes located in the GO/the total number of genes located in the GO, and the larger the GeneRatio, the higher the degree of GO enrichment. (B) The heatmap of the expression of different genes in different samples, where the abscissa is the sample and the ordinate are the gene. The different colors indicate different gene expression levels, and the color from blue to white to red indicates the expression level from low to high. (C) CXCL9 and CXCL10 mRNA expression in the mouse LLC and the human H1975 lung cancer lines were determined 24 h after treatment with ICT and the expression level increased at a dose-dependent manner. (D) Representative immunofluorescence staining images of CD8+ T cells and FoxP3+ regulatory T-cells infiltration in ICT-treated tumor and control group tissue sections. CD8+ T cells were stained red (CD8), FoxP3+ regulatory T-cells were stained green (FOXP3) and nuclei stained blue (DAPI). (E) Quantitative analysis of the ratio of CD8/FOXP3 in the figure (D). (F) T cell marker factors (CD8 and IFN-γ), chemokines (CXCL9 and CXCL10), and inflammatory factors (IL6, IL10 and TNF-α) mRNA expression were determined in ICT-treated tumor tissues by RT-PCR. *P < 0.05, **P < 0.005, ***P < 0.001, ****P < 0.0001 vs control group. (G) Protein expression of PD-L1 was determined in control (C) and ICT-treated tumor tissues by immunoblotting.