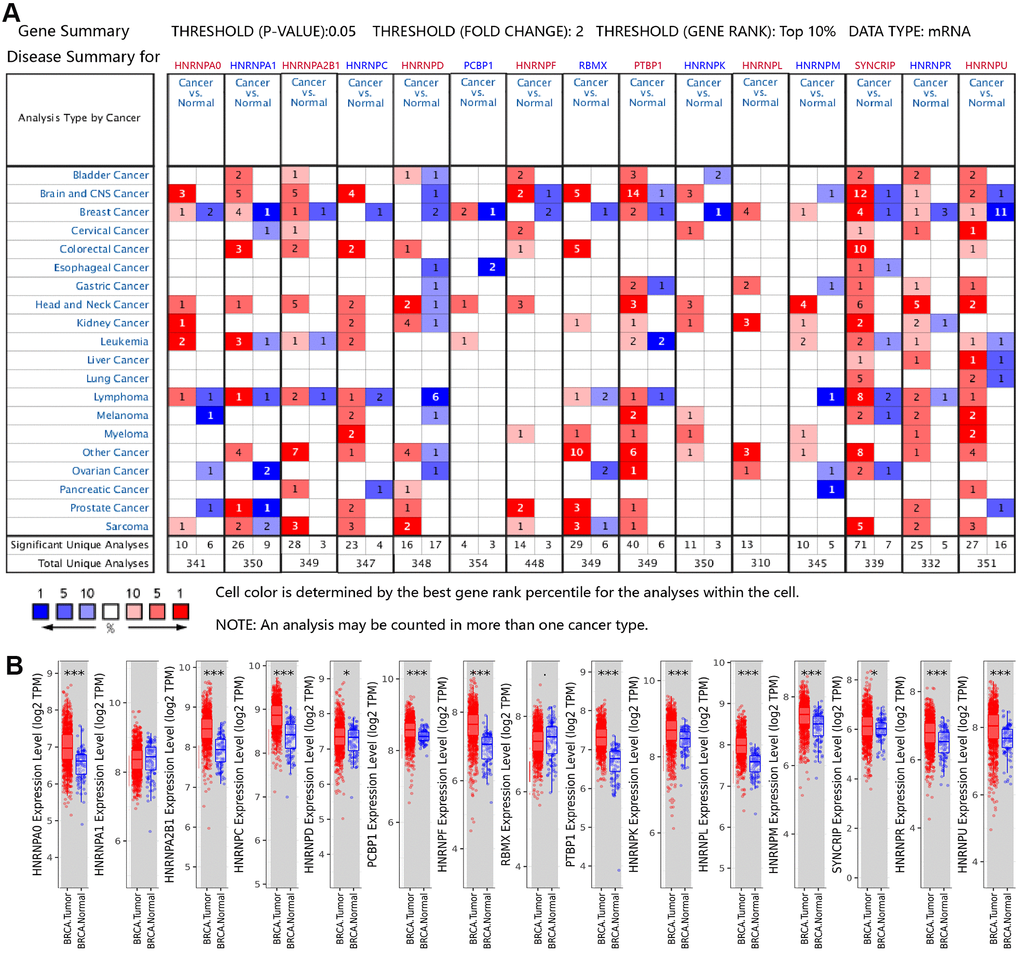
Figure 1.Aberrant mRNA expression of hnRNPs in BRCA. (A) mRNA expression of hnRNPs in various cancer types based on the Oncomine database. The Figure shows the number of datasets with statistically significant mRNA overexpression (red) or downregulated expression (blue) of hnRNPs in different types of cancer versus normal tissues. The threshold was designed with a P value of 0.05, fold change of 2, and gene ranking of 10%. The gene-rank percentile was analyzed for the top target gene from all genes measured in each research. Cell color was determined by the best gene-rank percentile for analysis within the cell. (B) Box plots showing the distribution of the expression of the hnRNPs across BRCA and normal tissue samples in the TCGA-BRCA dataset.*P < 0.05; **P < 0.01; ***P < 0.001.