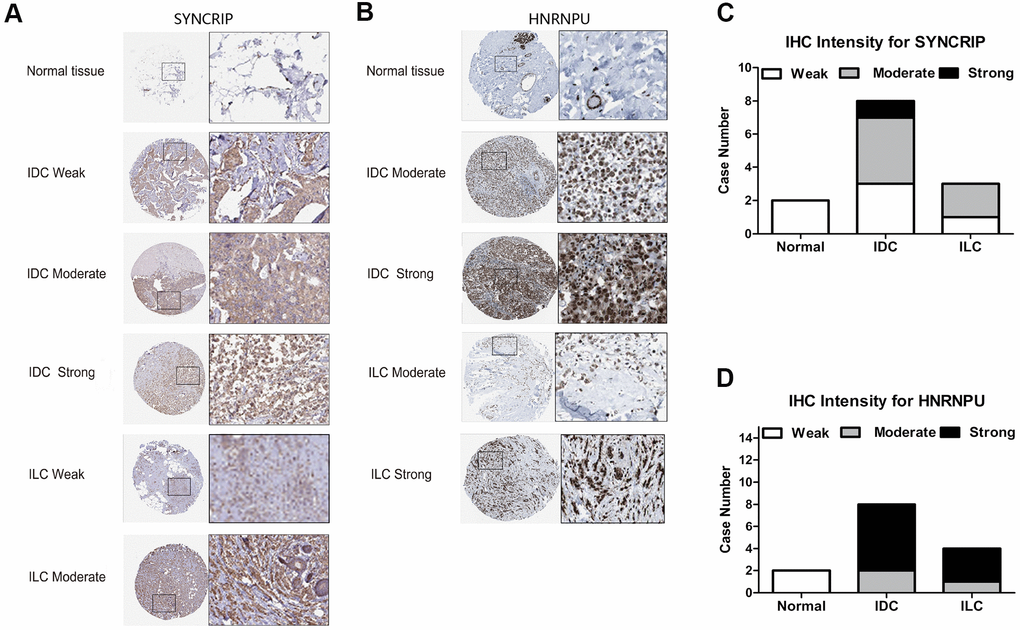
Figure 6.The IHC expression pattern of SYNCRIP and HNRNPU in normal breast tissues and BRCA. (A, B) Representative images are shown for strong, moderate, weak and negative expression of SYNCRIP and HNRNPU in normal breast tissues and BRCA (IDC and ILC). The black rectangle indicates a higher magnification of the indicated area in the image. (C) Bar chart of the IHC staining intensity of SYNCRIP for BRCA (a total of 13 cases). (D) Bar chart of the IHC staining intensity of hnRNPU for BRCA (a total of 14 cases).