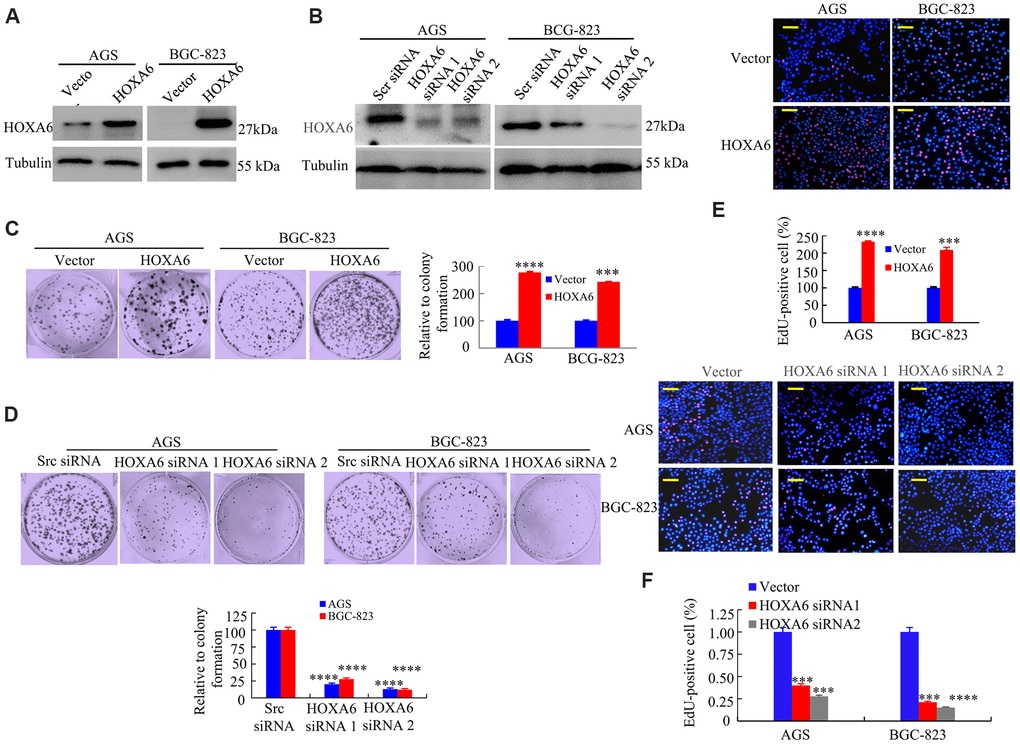
Figure 3.The effects of HOXA6 on proliferation in GC cells. (A, B) HOXA6 protein levels in HOXA6-overexpressing (A) or HOXA6 knockdown (B) measured the GC cell lines by Western blotting assay. b-Tubulin was used as a control. (C, D) Representative images from a colony formation assay with AGS and BGC-823 cells. Quantified colony numbers. Data are shown as the mean (n = 3) ± SD. ***, P < 0.01; ****, P < 0.001. (E, F) EdU incorporation assay in GC cells following transfection with HOXA6 plasmid or HOXA6 siRNA. EdU-positive cells was indicated by red fluorescence, and the total cells was indicated blue fluorescence from Hoechst stain. ***, P < 0.01; ****, P < 0.001. Scale bars in E and F represent 100 μm.