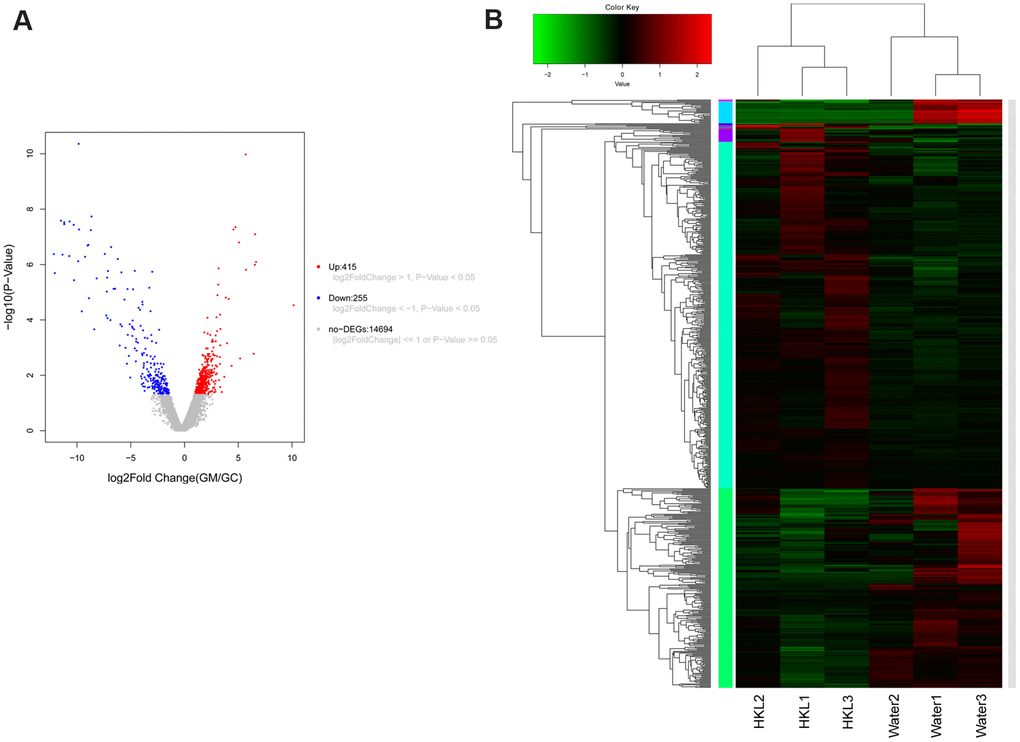
Figure 4.Expression signature of differentially expressed genes (DEGs). (A) Volcano plot displayed the distribution of DEGs. The blue dots represent down-regulated genes and the red dots represent up-regulated genes. (B) Heatmap of DEGs (n = 3 in each group). Each row represents one individual sample, and each column represents one gene. High expression levels are shown in red and low expression levels in green. UC rats were treated with water or HKL for 7 days and colon tissues were extracted for transcriptomics analysis.