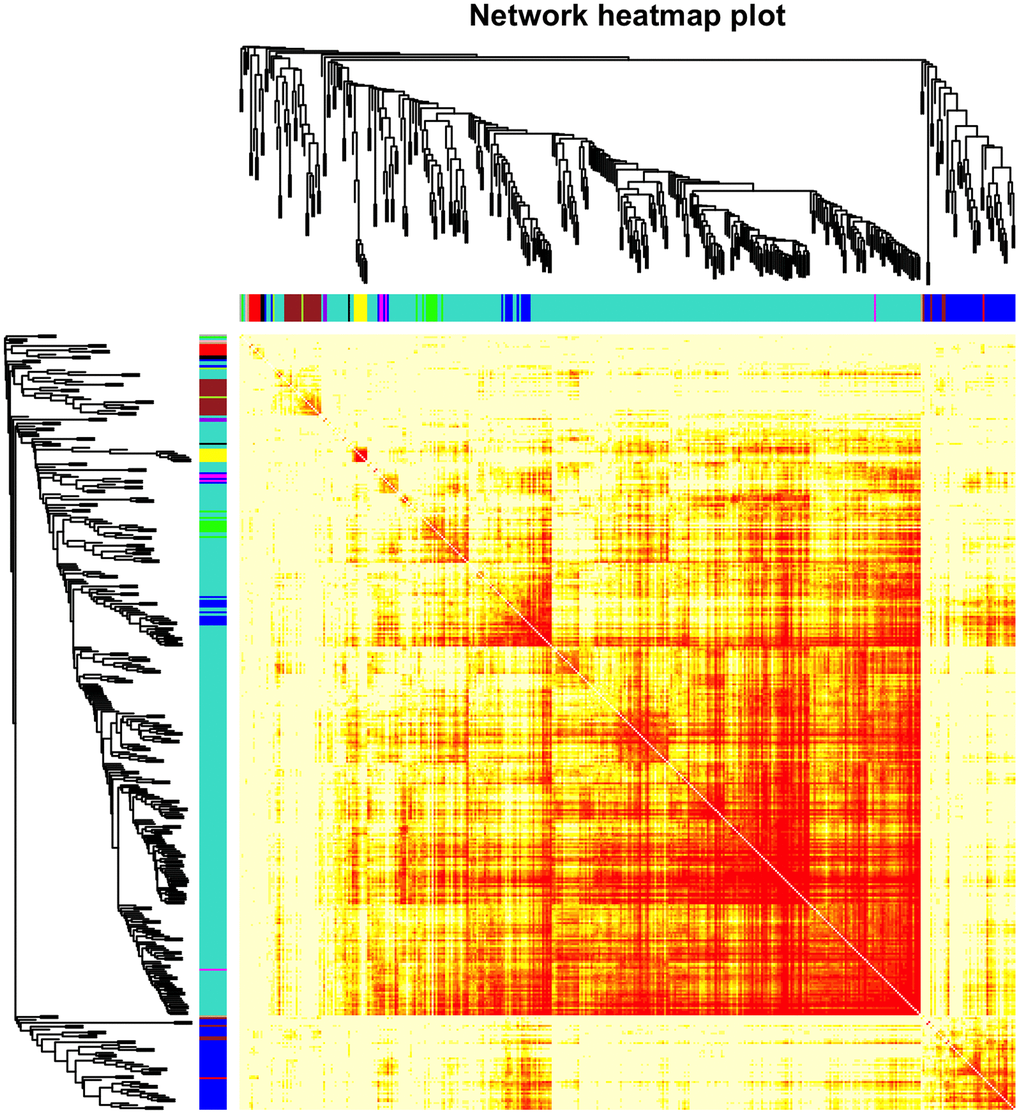
Figure 3.Heatmap of the gene network. TOM plot for all the genes in the analysis. Light colors represent low overlap and progressively darker (red) colors represent higher overlap. Darker blocks along the diagonal correspond to modules. The gene dendrogram and module assignment are also shown along the left and top sides.