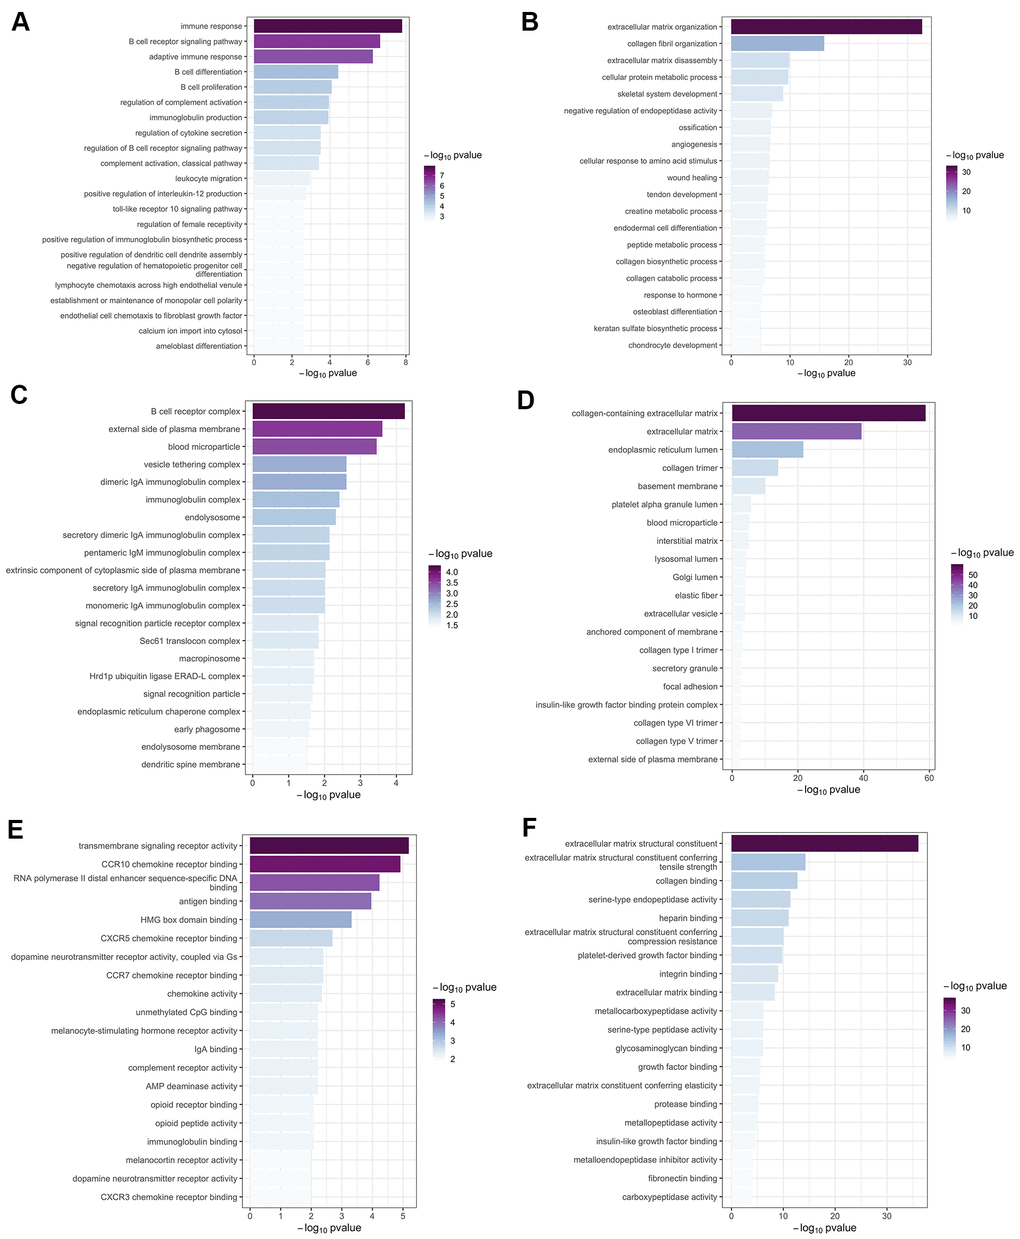
Figure 5.Gene ontology enrichment analysis. The top 20 significant (p < 0.05) GO terms were screened in the green-yellow and brown modules. Column color was used to map the p value of specific functional items: darker colors indicate smaller p values (greater significance) for the corresponding enrichment. Results are shown for (A) biological process in the yellow-green module; (B) biological process in the brown module; (C) cellular component in the yellow-green module; (D) cellular component in the brown module; (E) molecular function in the yellow-green module; and (F) molecular function in the brown module.