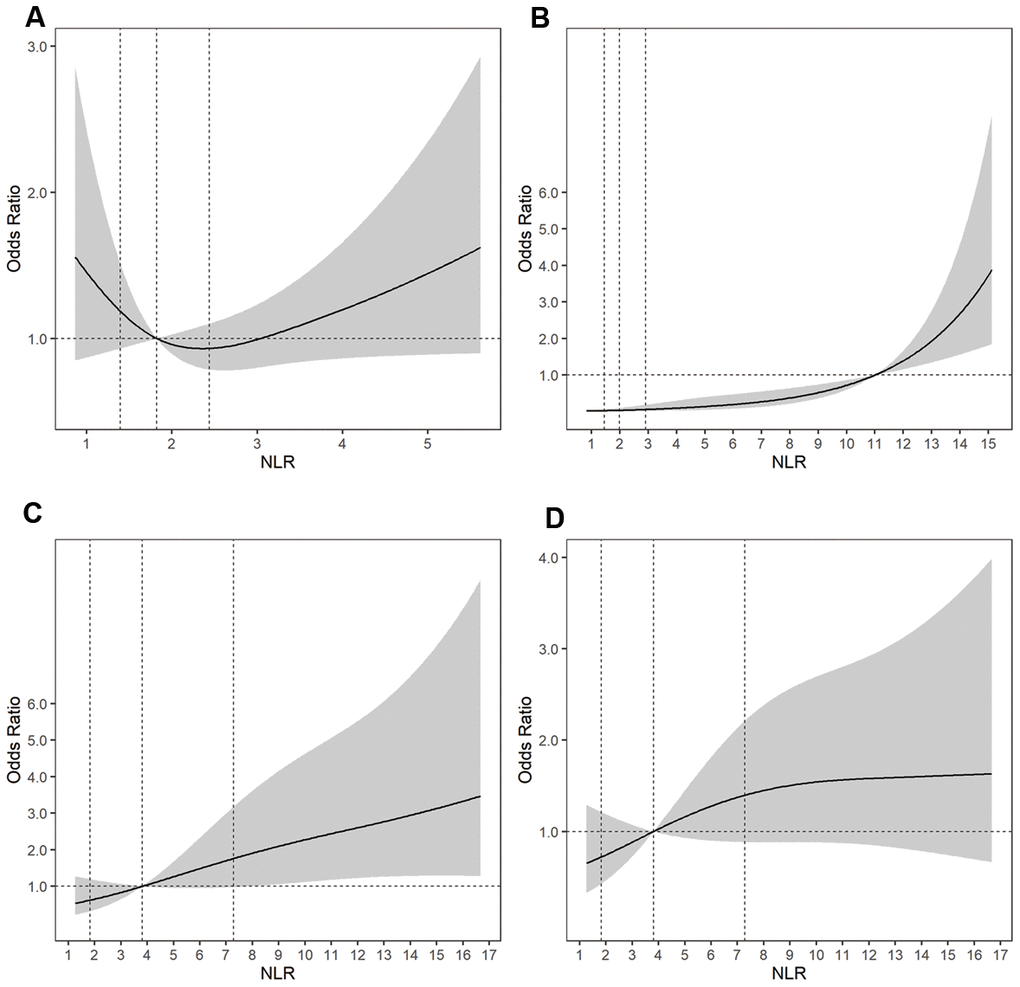
Figure 2.Adjusted ORs of (A) aneurysm size for uIAs, (B) aneurysm rupture, (C) a poor outcome at 3 to 6 months for rIAs, and (D) DCI for rIAs according to the NLR. The solid line indicates the adjusted OR and the shadow the 95% confidence interval bands. The reference is the 50th percentile of the NLR for aneurysm size, DCI, and a poor outcome, and NLR = 11.0 for aneurysm rupture. The other vertical dashed lines indicate the first, second, and third quartiles of the NLR. The data were fitted using a logistic regression model of restricted cubic splines with three knots for the NLR, adjusting for potential covariates as Model 2 in Table 2. The lowest 5% and highest 5% of participants are not shown in the figures. ORs, odds ratios; rIAs, ruptured intracranial aneurysms; uIAs, unruptured intracranial aneurysms; NLR, neutrophil-to-lymphocyte ratio; DCI, delayed cerebral ischemia.