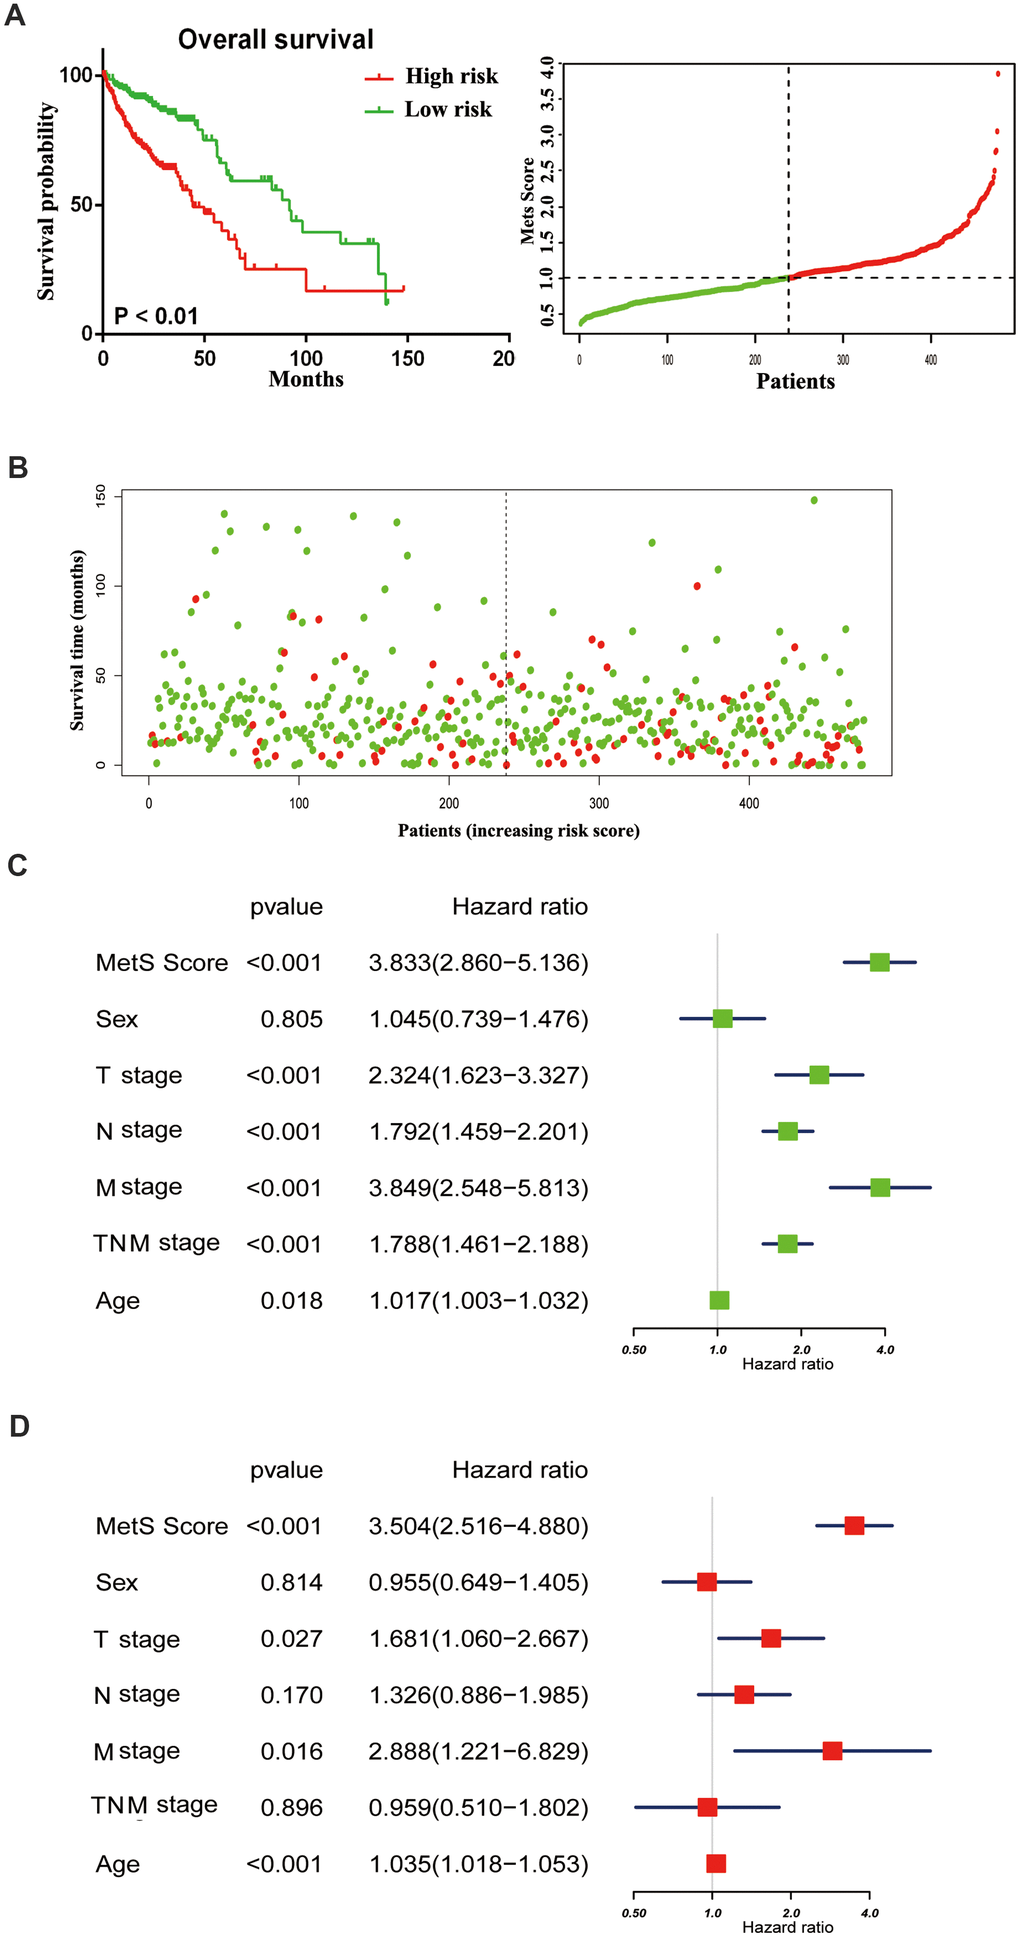
Figure 2.The distribution of gene MetS Score in the TCGA cohort. (A). K-M survival curve of the low- and high- MetS Score for TCGA CRC patients; (B). The distributions of the MetS Score and survival status for each CRC patients; (C). Forest plot summary the univariable analyses of overall survival of gene MetS Score; (D). Forest plot summary the multivariable analyses of overall survival of gene MetS Score.