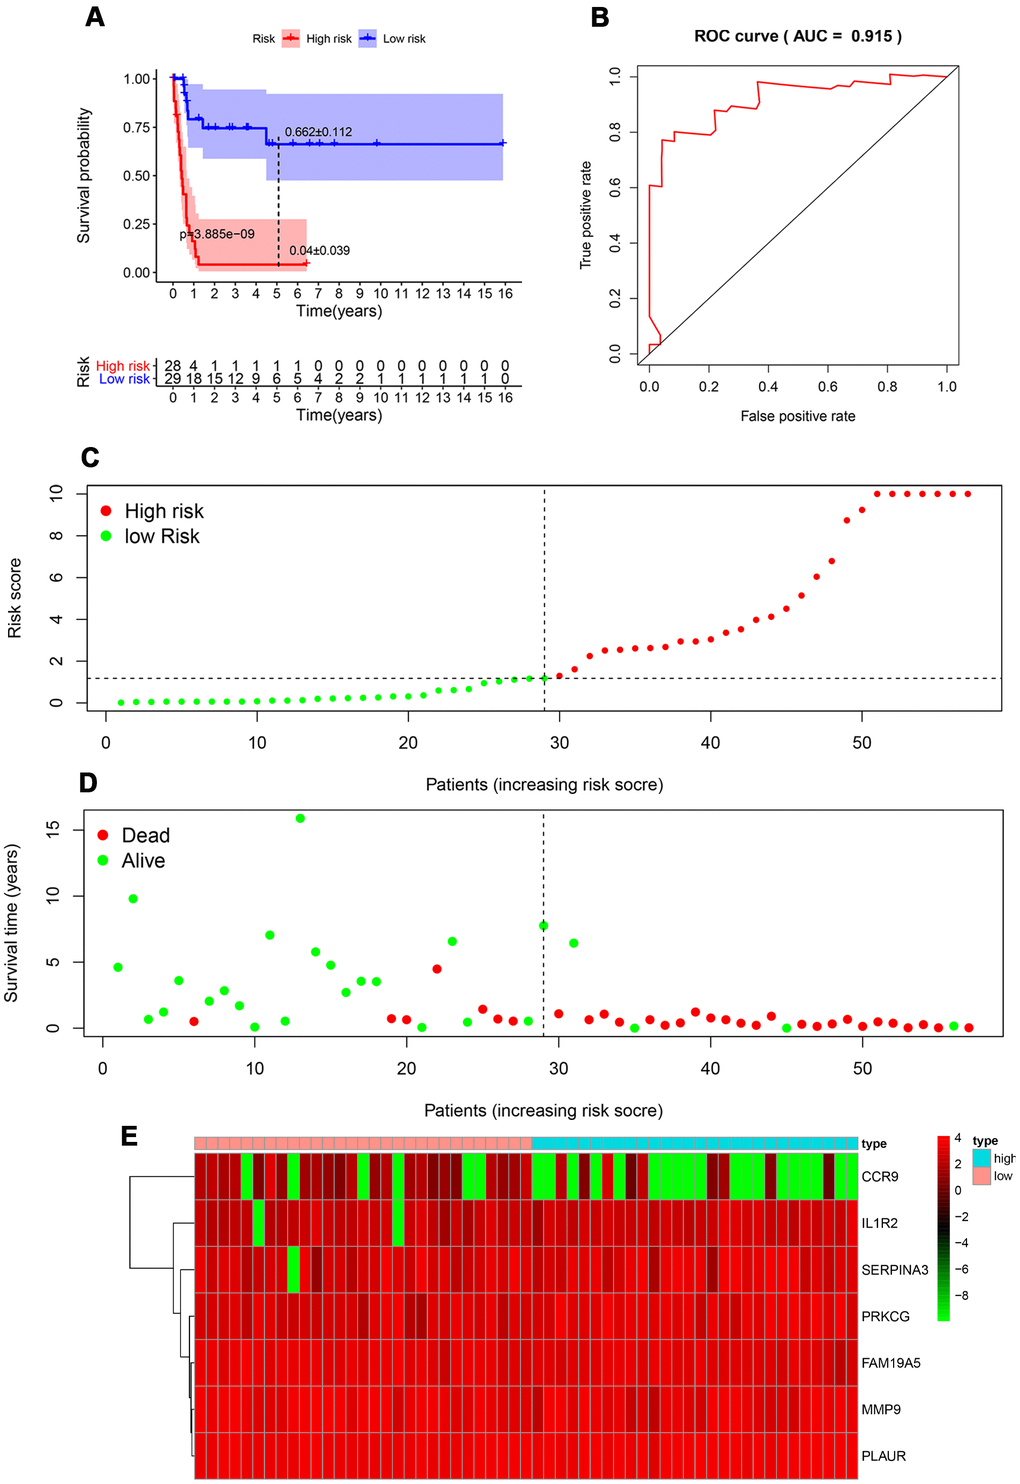
Figure 4.Prognostic analysis of the TARGET-RTK cohort. (A) Kaplan-Meier curve analysis of the high-risk and low-risk groups. (B) Survival-dependent receiver operating characteristic (ROC) curve validation of the prognostic value of the prognostic index. (C) Dot plot of the risk score. Vertical and horizontal axes represent risk score and RTK samples, ranked by increasing risk score. Red and green colors represent high-and low-risk cases, respectively. (D) Dot plot of survival. Vertical and horizontal axes represent the survival times and RTK samples, ranked by increasing risk score. Red and green colors represent dead and living RTK cases, respectively. (E) Heat map of the expression levels of the seven genes. Vertical and horizontal axes represent genes and RTK samples, ranked by increasing risk score. Genes with higher, lower, and same expression levels are shown in red, green, and black, respectively. Color bars at the top of the heat map represent sample types, with pink and blue indicating low- and high-risk score samples, respectively. Abbreviation: RTK, rhabdoid tumor of kidney.