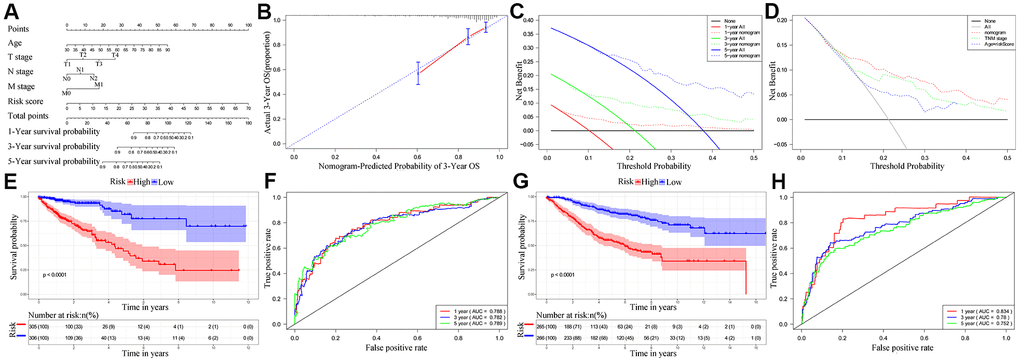
Figure 6.Establishment and validation of the nomogram for predicting overall survival of CRC patients in the TCGA and GSE39582 cohorts. (A) Nomogram with the ten-IRG prognostic risk score, TNM stages and age for predicting the 1-year, 3-year, and 5-year OS of CRC patients. In the nomogram, each variable is assigned a score. The sum of scores for all variables is used to predict the probability of survival of the CRC patients. (B) Calibration plot shows the comparison between nomogram predicted and actual 3-year OS of the TCGA cohort. (C) Decision curve analysis shows the predicted 1-year, 3-year and 5-year overall survival of CRC patients based on the nomogram. (D) Decision curve analysis shows the predicted 1-year, 3-year, and 5-year OS of CRC patients based on the nomogram, TNM stage only, and age plus ten-IRG signature. (E) Kaplan–Meier survival curves show the overall survival of CRC patients in the TCGA cohort based on the nomogram. (F) Time-dependent ROC curves show the accuracy of overall survival prediction in the TCGA cohort based on the nomogram. (G) Kaplan–Meier survival curves show the overall survival of CRC patients in the GSE39582 cohort based on the nomogram. (H) Time-dependent ROC curves show the accuracy of overall survival prediction in the GSE39582 cohort based on the nomogram.