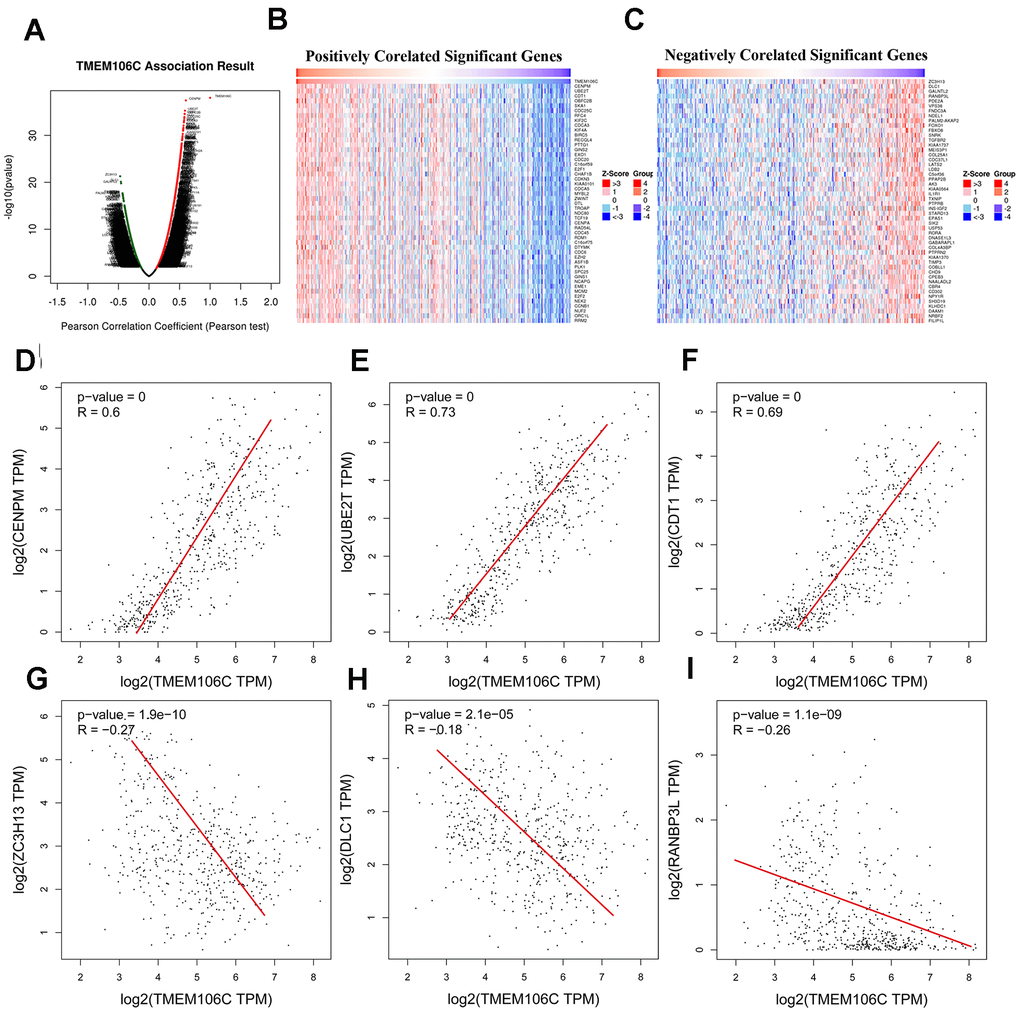
Figure 4.TMEM106C expression correlated genes in HCC (LinkedOmics and GEPIA). (A) Correlations between TMEM106C and differentially expressed genes in LIHC from LinkedOmics (Pearson test). Red indicates positively correlated genes, and green indicates negatively correlated genes. (B, C) Heat maps showing the top 50 genes positively and negatively correlated with TMEM106C in LIHC. (D–F) The scatter plots show the Pearson correlation of TMEM106C expression with the most positively correlated genes: CENPM, UBE2T and CDT1 (GEPIA). (G–I) The scatter plot shows the Pearson correlation of TMEM106C expression with the most 33 negatively correlated genes: ZC3H13, DLC1 and RANBP3L (GEPIA).