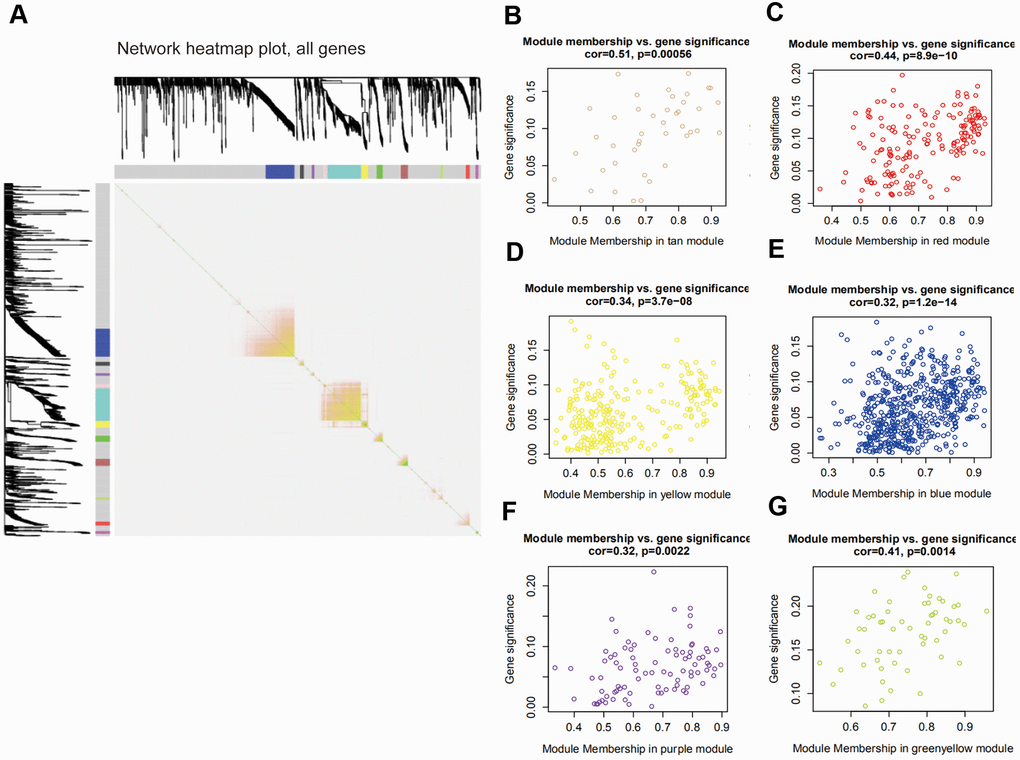
Figure 3.Interaction among modules and identification of pivotal modules. (A) Interaction of co-expression genes. Different colors of horizontal axis and vertical axis represent different modules. The brightness of yellow in the middle represents the degree of connectivity of different modules. (B–G) Scatter plots of module eigengenes in corresponding modules that correlated with clinical features.