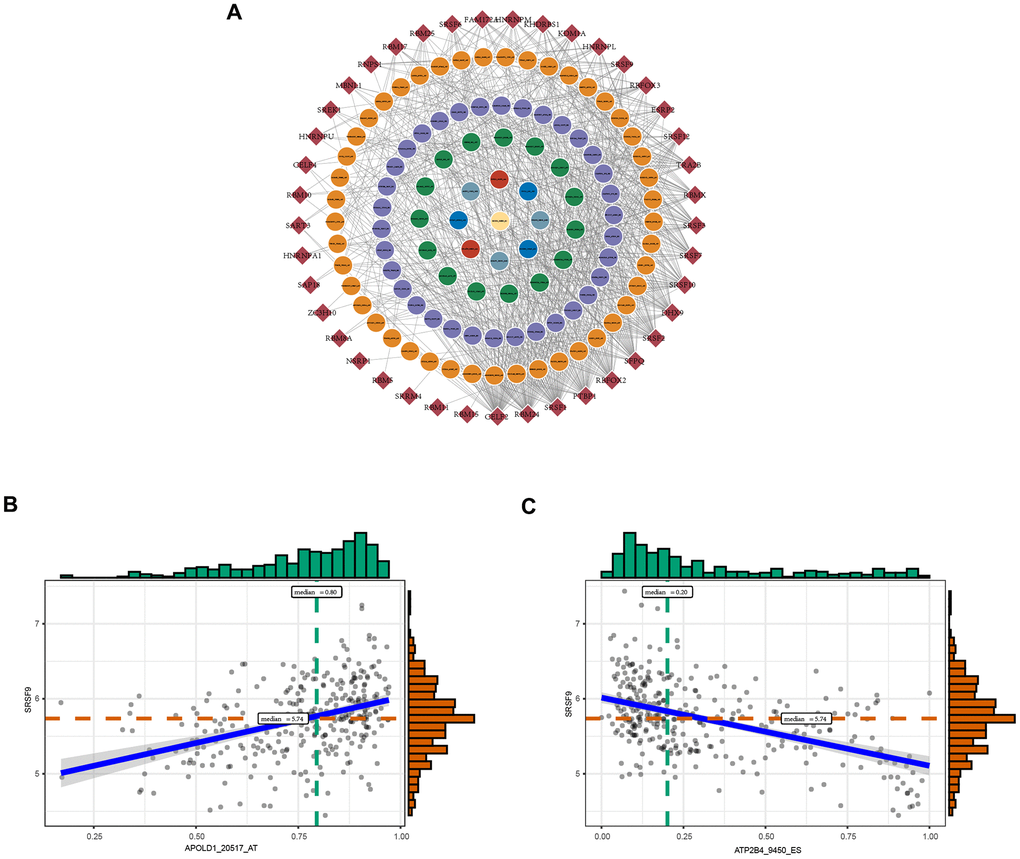
Figure 3.The regulatory splicing correlation network in GC. (A) The correlation of OS-GCAS events with SFs is shown in network plots. The circular node represents the OS-GCAS event. The diamond node represents the SF. (B) Representative positive correlations between OS-GCAS events and SFs are shown in scatter plots. (C) Representative negative correlations between OS-GCAS events and SFs are shown in scatter plots.