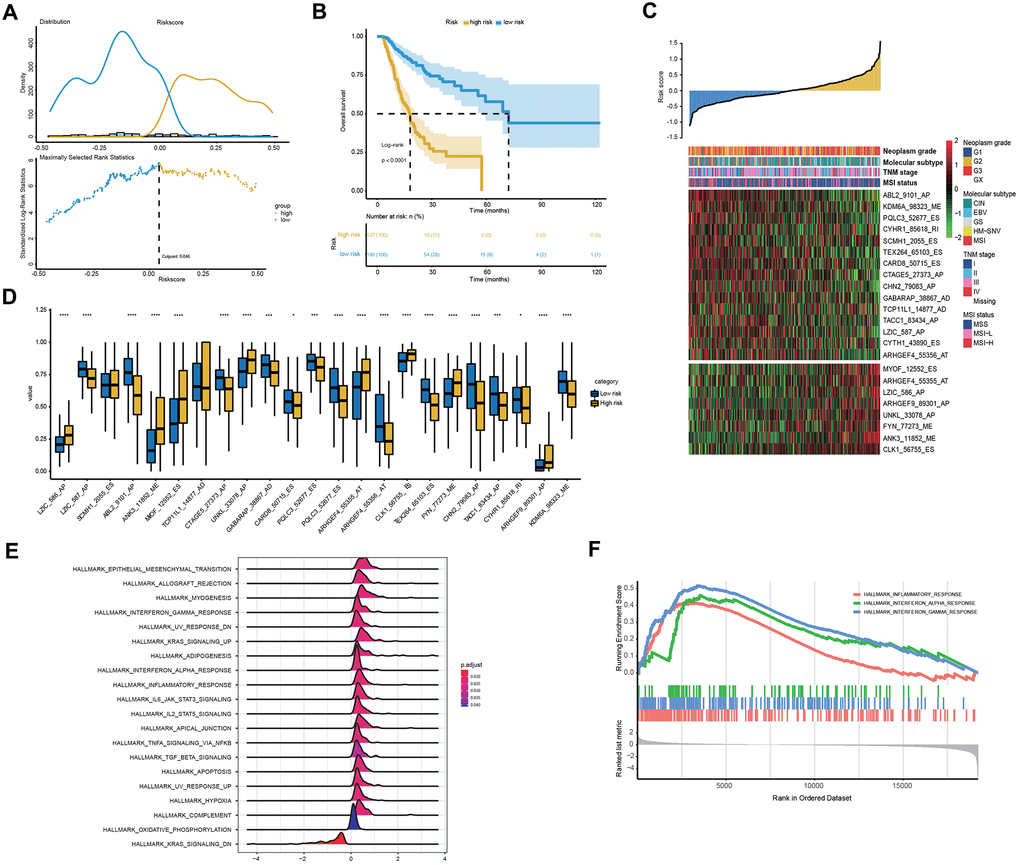
Figure 5.Clinical and molecular features underlying the 23-AS event signature. (A) The optimal cut-off of the 23-AS event signature in the entire TCGA dataset. (B) Kaplan-Meier curve with difference detection by log-rank test for patients in the entire TCGA dataset. (C) Heat map for the expression patterns of the 23 OS-GCAS events for the entire TCGA sample set sorted by the risk score in ascending order. (D) The differential expression of the 23 OS-GCAS events between the high- and low-risk groups. (E, F) GSEA of the 50 hallmark gene sets between the high- and low-risk groups.