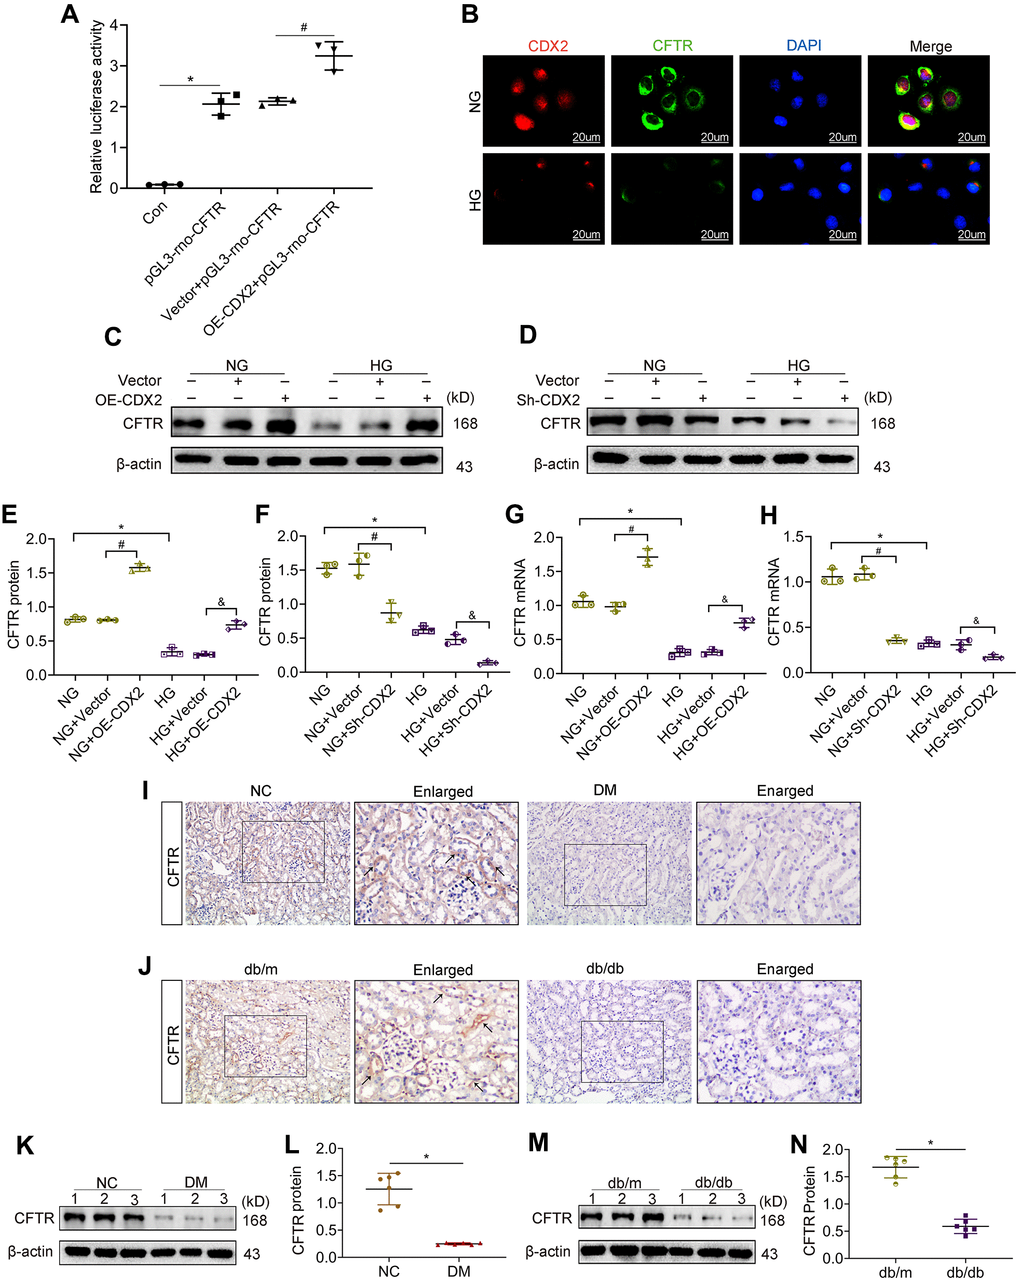
Figure 4.CFTR is a downstream target gene of CDX2, and downregulated in DKD. (A) CFTR promoter activity increased in CDX2-overexpressing NRK-52E cells. NRK-52E cells were administered non-transfected (Con)/pGL3-rno-CFTR-promoter plasmid (pGL3-rno-CFTR), or co-transfected with CDX2-overexpressing/Vector plasmid and pGL3-rno-CFTR-promoter plasmid. n=3; *P<0.05 versus Con group; #P<0.05 versus Vector + pGL3-rno-CFTR group. (B) Immunofluorescent staining of CDX2 and CFTR in NRK-52E cells of the NG and HG groups, respectively (scale bar, 20μm). C-H Western blot bands (C, D) and protein quantitation (E, F) of CFTR in non-transfected (NG or HG treated) NRK-52E cells, and NRK-52E cells transfected with Vector (NG+Vector, HG+Vector), CDX2-overexpressing (NG+OE-CDX2, HG+OE-CDX2) or CDX2-knockdown (NG+Sh-CDX2, HG+Sh-CDX2) plasmid, and mRNA levels (G, H). Data are mean±SD from three experiments performed independently. n=3; *P<0.05 versus NG group; #P<0.05 versus NG+Vector group; &P<0.05 versus HG+Vector group. (I, J) Immunohistochemical staining of CFTR in T1D model mice and controls (J), T2D mice and controls (J). n=6; *P<0.05 versus NC group or db/m group. (K, L) Western blot bands of CDX2 in T1D model mice and controls (K), and quantitative data (L). (M, N) Western blot bands of CFTR in T2D model mice and controls (M), and quantitative data (N). Data are mean±SD from three independent assays. n=6; *P<0.05 versus NC group or db/m group.