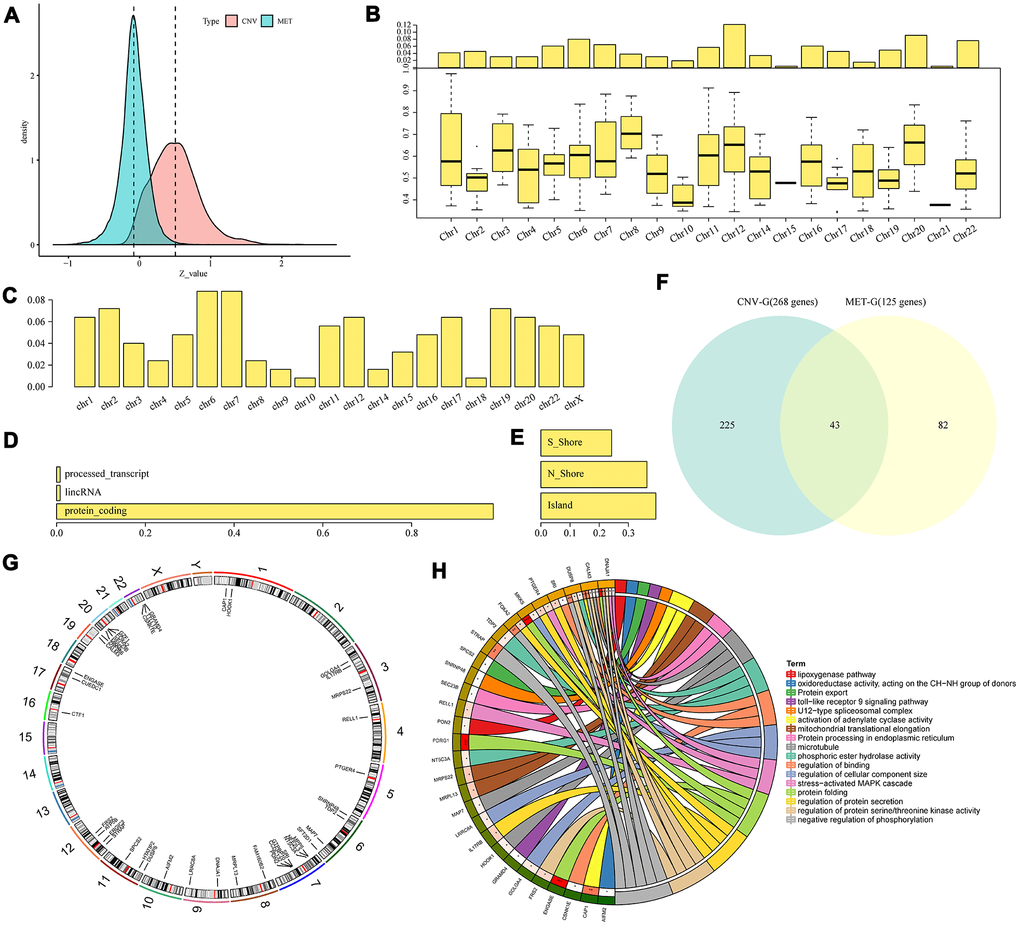
Figure 3.Identification of CNV-G and MET-G gene sets. (A) Correlation z-values between CNV (CNV-G) and expression profiles, or between methylation (MET-G) and expression profiles. Distributions of (B) CNV-Gs and (C) MET-Gs on the genome were mapped. (D) Functional composition and (E) distribution of methylation sites were determined for MET-Gs. (F) The overlapping part between prognostic CNV-Gs and MET-Gs. (G) Chromosomal localization of the 43 genes and (H) their functional annotations. Different colors in the right half circle represent different pathways, the outer ring in the left half circle represents the genes corresponding to the pathway, the corresponding inner ring represents the significant P value, and the connections in the circle represent the relationship between the pathway and genes.