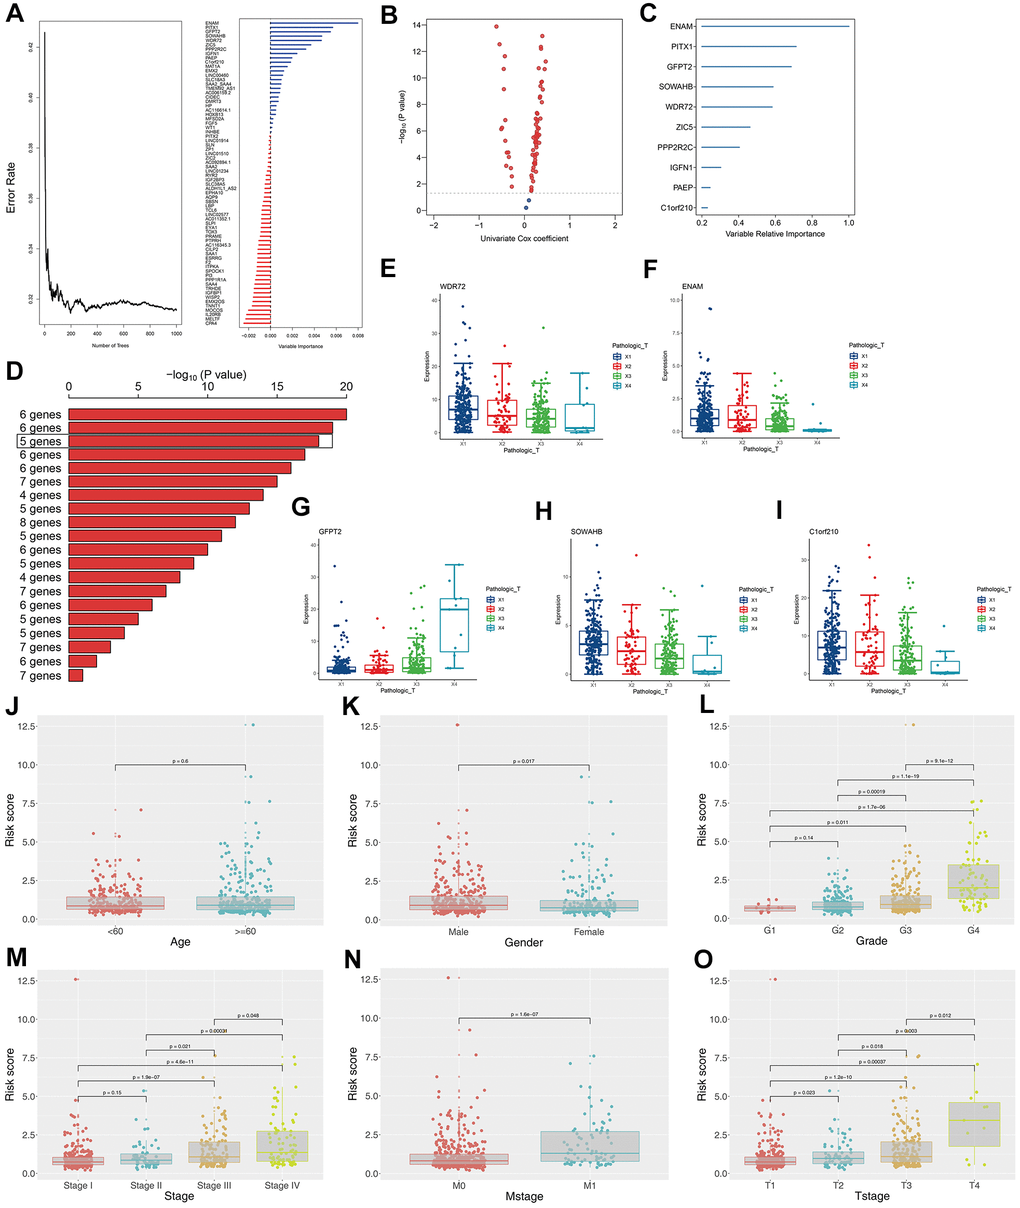
Figure 3.Construction of the prognosis model based on the T classification related genes. (A) Error rate for the data as a function of the classification tree and out-of-bag importance values all the predictors; (B) Volcano plot displayed the genes of the univariate Cox regression analysis; (C) Random survival forest analysis screened 10 genes; (D) After Kaplan–Meier analysis of 2 –1 = 1,023 combinations, the top 20 signatures were sorted according to the p value of KM. And the signature included five genes that were screened out, for it had a relative big −log10 p value and a small number of genes; (E) The association between WDR72 expression with T classification; (F) The association between ENAM expression with T classification; (G) The association between GFPT2 expression with T classification; (H) The association between SOWAHB expression with T classification; (I) The association between C1orf210 expression with T classification; (J) The correlation between risk scores and age; (K) The correlation between risk scores and gender; (L) The correlation between risk scores and grade; (M) The correlation between risk scores and stage; (N) The correlation between risk scores and Mstage; (O) The correlation between risk scores and Tstage.