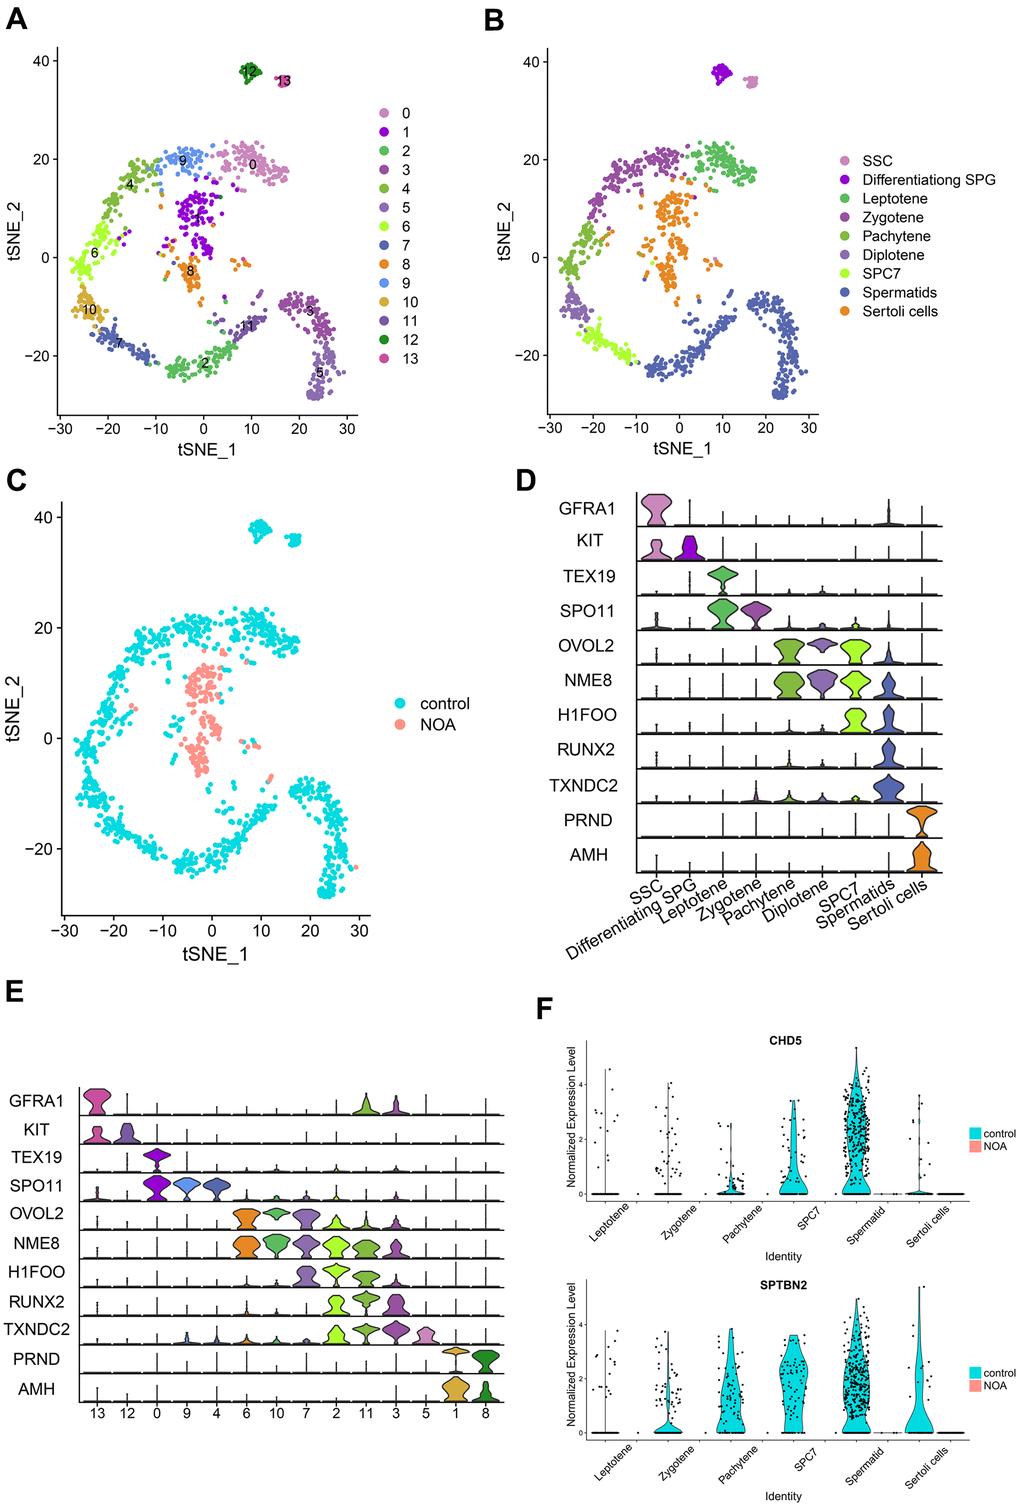
Figure 3.Identification and comparison of different cell types in different samples based on the single-cell RNA-seq dataset. (A) Cell cluster distribution in the TSNE plot. (B) Different types of cells and different samples identified in tSNE plots. SSC, spermatogonial stem cells; Differentiating SPG, differentiating spermatogonia; SPC7, cell mixtures including diakinesis, metaphase, anaphase, telophase, and secondary spermatocytes. (C) Comparison of different samples in tSNE plots. (D) Multiviolin plot of expressions of specific gene markers in identified cell types. X-axis represents diverse cell types. Y-axis represents the expression of specific gene markers. (E) Multiviolin plot of expressions of specific gene markers in different clusters. X-axis represents different clusters. Y-axis represents the expressions of specific gene markers. (F) The expression validation of hub genes from diverse cell types in the NOA group compared with the control group. The Y-axis expressions were normalized by log2(TPM/10+1).