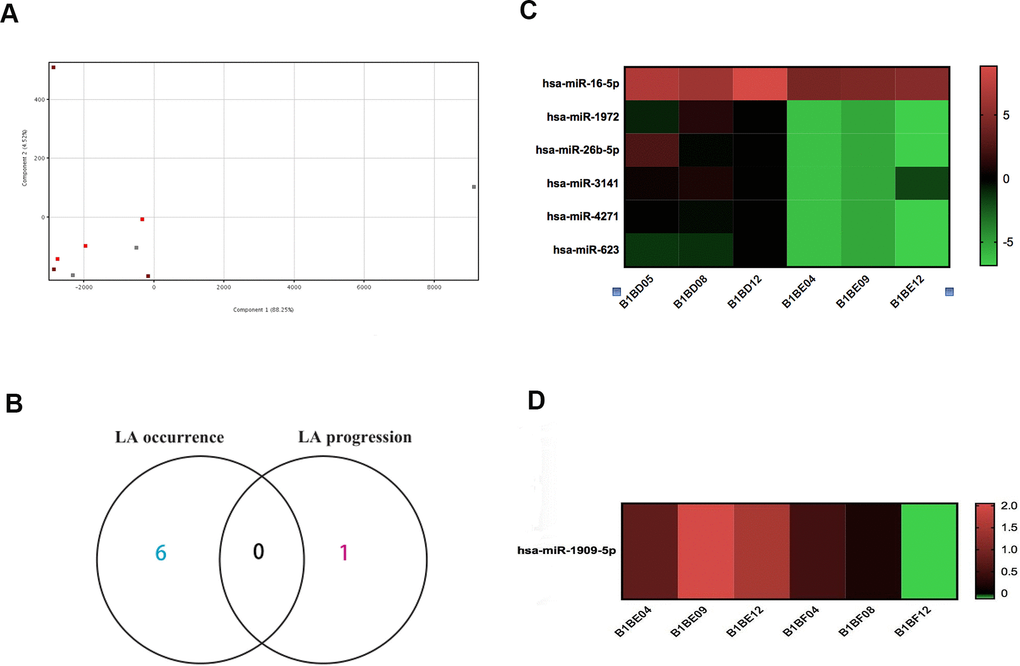
Figure 1.Microarray miRNA expression profiling of LA in whole blood. (A) PCA of samples shows a small difference among the three groups of subjects. Each symbol represents one subject, with red symbols indicating subjects with type I LA (n=3), orange indicating subjects with type II LA (n=3), and gray indicating subjects without LA (n=3). (B) Venn diagram of differentially expressed miRNA identified in the comparison of LA type I vs. Normal and in the comparison of LA type II vs. LA type I did not reveal genes common to onset-associated miRNA and progression-associated miRNA. (C) Heatmap of miRNA expression profiling showed six differentially expressed miRNAs identified in the comparison of LA type I (B1BE04, B1BE09, and B1BE12) vs. Normal (B1BD05, B1BD08, and B1BD12). The miRNAs were regarded as LA onset-associated miRNAs. (D) Heatmap of miRNA expression profiling showing a single, differentially expressed miRNA in the comparison between LA type II (B1BF04, B1BF08, and B1BF12) vs. LA type I (B1BE04, B1BE09, and B1BE12). This miRNA was designated as an LA progression-associated gene. Red indicates up-regulated expression levels of miRNA, and green indicates down-regulated miRNA expression.