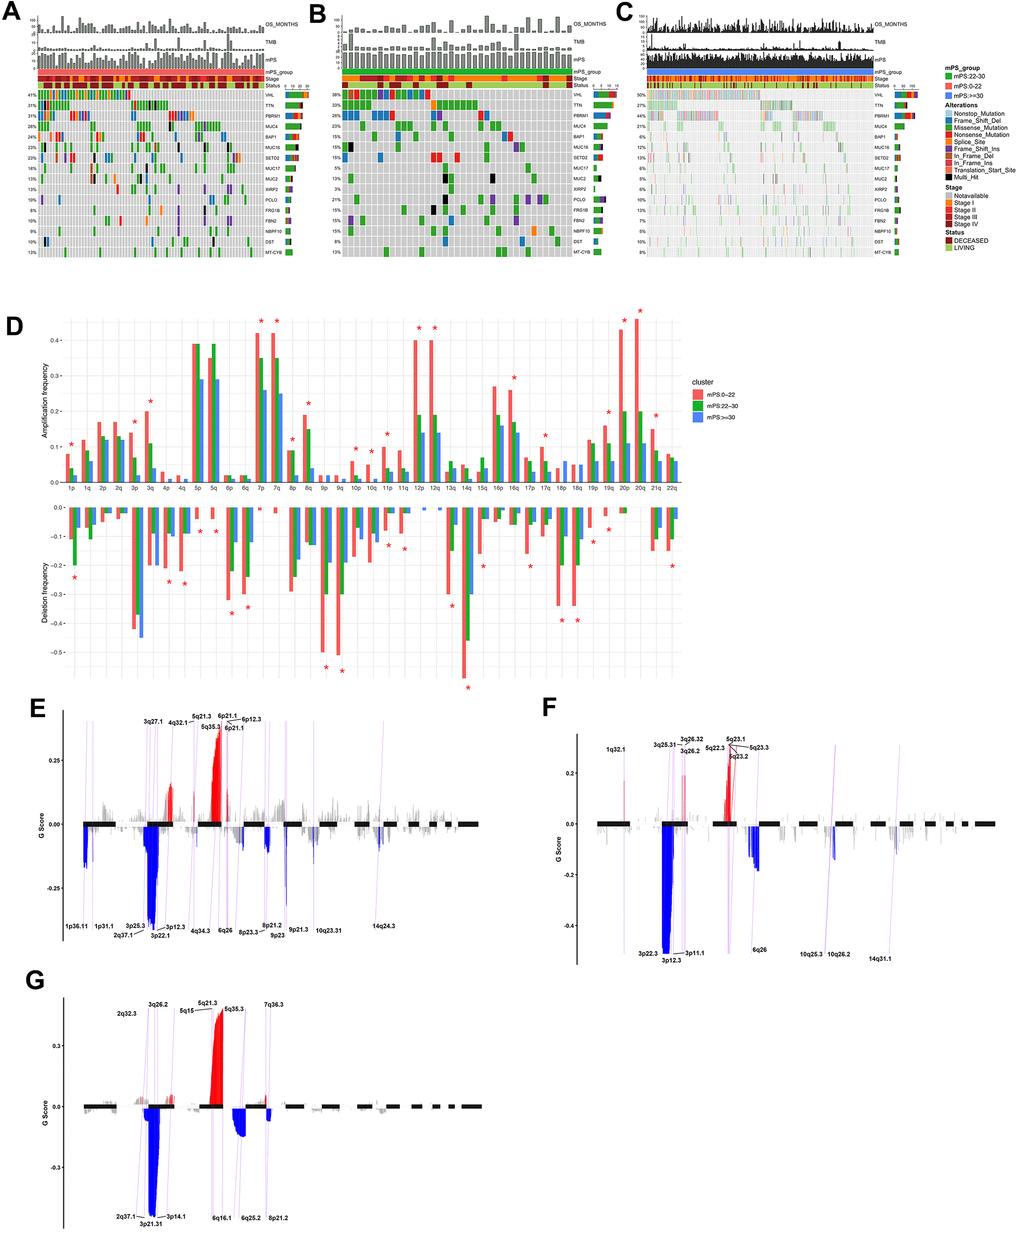
Figure 7.Mutations and copy number variations in the three subgroups stratified by mPS system. (A–C) Distribution and phenotype of common gene mutations in the three subgroups stratified by mPS system: (A) low-mPS group (mPS<22); (B) median-mPS group (22≤mPS<30); (C) high-mPS group (mPS>30). (D) The levels of amplification and deletion of chromosome arms of the three subgroups stratified by mPS system. Objects with pentagrams indicate there is a significant difference in the frequency distribution among the three subgroup (P < 0.01); (E–G) The copy number variations located on minimal common regions (MCRs) of the three subgroups stratified by mPS system: (E) low-mPS group (mPS<22); (F) median-mPS group (22≤mPS<30); (G) high-mPS group (mPS≥30).