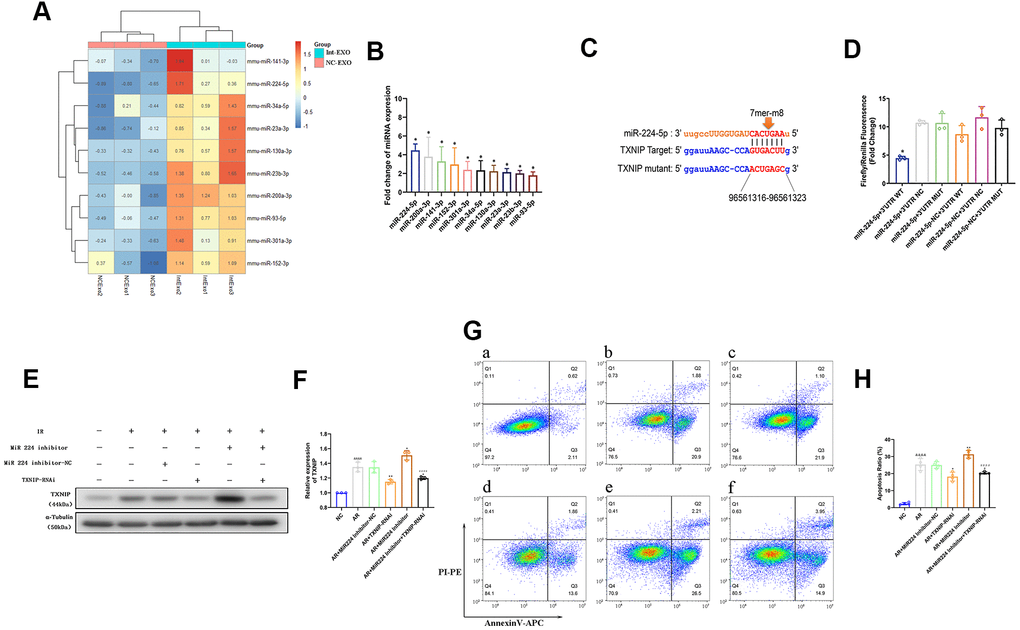
Figure 4.Anoxia-induced, EV-associated miR-224-5p inhibits I/R-mediated apoptosis in cardiomyocytes by downregulating TXNIP. (A) MicroRNA sequencing analysis in ADSC-EVs. A total of 41 miRNAs were upregulated in Int-EVs compared to NC-EVs. Ten of them (shown in the heatmap) were predicted to associate with TXNIP. (B) Validation of differential EV-associated miRNA expression through qRT-PCR. U6 snRNA served as internal reference (*P < 0.05, compared with NC-EVs; n=3). (C) Dual-luciferase reporter assay. HEK 293 T cells were co-transfected with miR-224-5p mimics and PGL3 luciferase reporter plasmids containing wild-type or mutated TXNIP 3′UTR. An NC-TXNIP 3′UTR served as control. (D) Dual-luciferase reporter assay analysis (*P < 0.05, miR-224-5p + TXNIP WT 3′UTR vs mutated- and NC-3’UTR groups; n=3). (E) Analysis of TXNIP and miR224-5p expression in AR-treated mouse cardiomyocytes transfected with a miR224-5p inhibitor and/or TXNIP-targeting siRNAs (TXNIP-RNAi). (F) Statistical analysis of data from experiments like those shown in (E); (&P < 0.05, &&P < 0.01, &&& P < 0.001, &&&&P < 0.0001, compared with the control group; n = 3; *P < 0.05, **P < 0.01, *** P < 0.001, **** P < 0.0001, compared with the AR group; n = 3; #P < 0.05, ##P < 0.01, ### P < 0.001, #### P < 0.0001, compared with the AR + inhibitor group; n = 3). (G) Representative images of Annexin V/PI-stained cardiomyocytes transfected with a miR224-5p inhibitor and/or TXNIP-targeting siRNAs prior to AR. a) NC: non-AR control; b) AR; c) Inhibitor-NC + AR: miR224-5p inhibitor (negative control) pre-treatment followed by AR; d) TXNIP-RNAi + AR: TXNIP-RNAi pre-treatment followed by AR; e) Inhibitor + AR: miR224-5p inhibitor pre-treatment followed by AR; f) Inhibitor + TXNIP-RNAi + AR: miR224-5p inhibitor plus TXNIP-RNAi pre-treatment followed by AR. (H) Statistical analysis of Annexin V/PI staining experiments. (&P < 0.05, &&P < 0.01, &&& P < 0.001, &&&&P < 0.0001, compared to control; n = 4; *P < 0.05, **P < 0.01, *** P < 0.001, **** P < 0.0001, compared to AR; n = 4; #P < 0.05, ##P < 0.01, ### P < 0.001, #### P < 0.0001, compared to miR224-5p inhibitor + AR; n = 4).