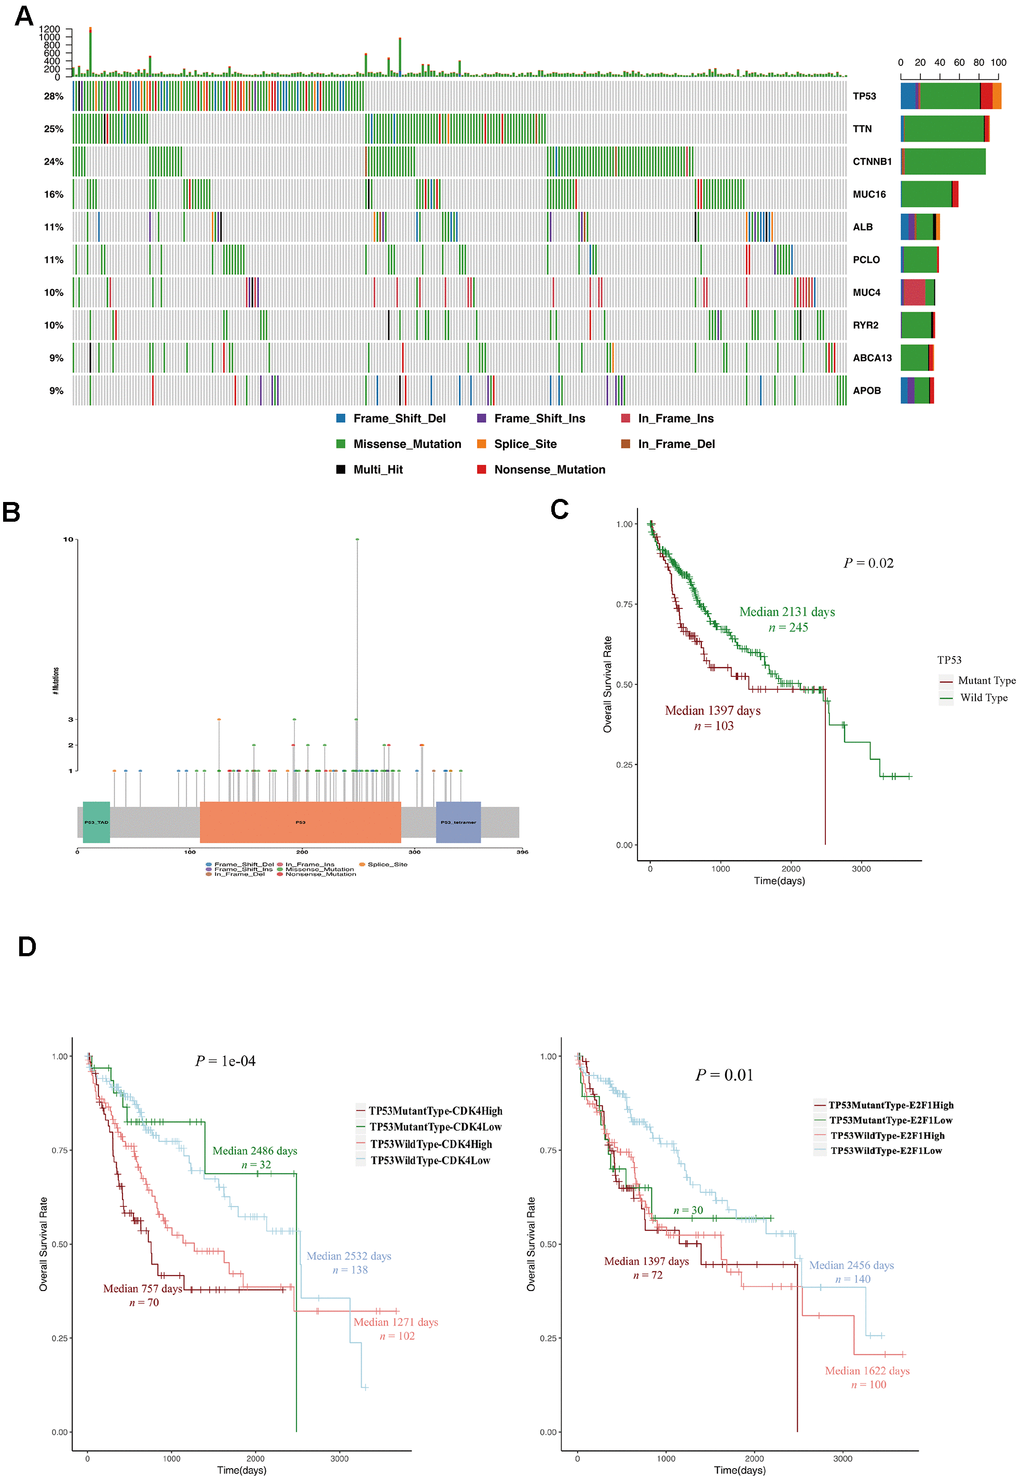
Figure 5.TP53 mutations were associated with a poor prognosis in HCC patients. (A) OncoPlot of the top ten mutated genes. The upper bar plot indicates the number of genetic mutations per patient, while the right bar plot displays the number of genetic mutations per gene. The mutation types were added as annotations on the bottom. Variants annotated as Multi_Hit are genes that mutated more than once in the same sample. (B) The lollipopPlot of TP53. The amino acid axis was labeled for the domain. The mutation types were added as annotations on the bottom. (C) Kaplan-Meier curve and log-rank test for HCC patients based on the TP53 mutational status classification. (D) Kaplan-Meier curve and log-rank test for HCC patients based on the TP53 mutational status and the expression of CDK2 and E2F1. The patients were stratified into the high expression group and the low expression group according to the median of normalized RNA-seq data. The patients were stratified into mutant TP53 group and wild type TP53 group according to TP53 mutational status.