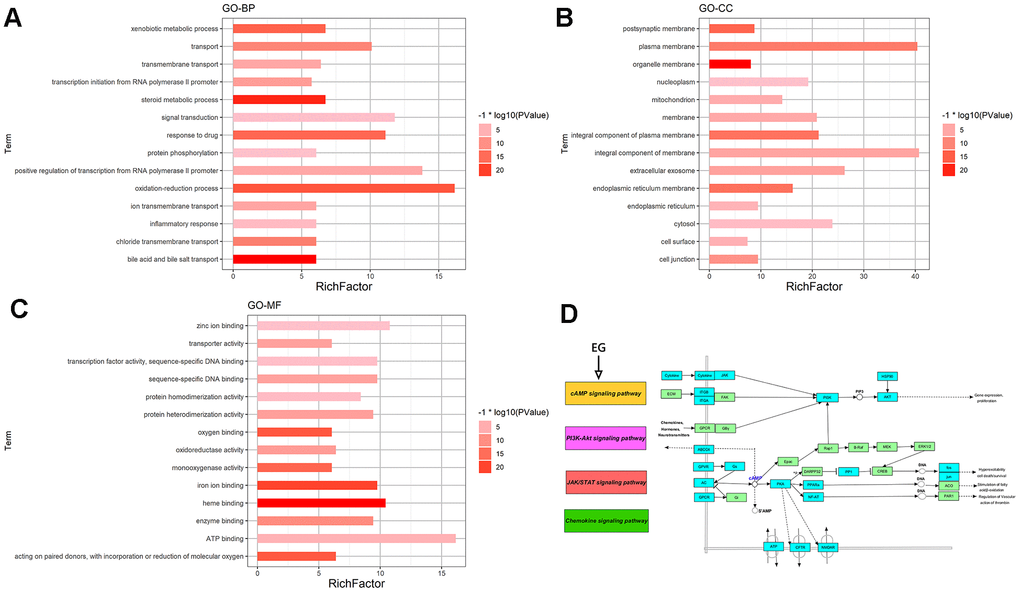
Figure 2.GO and pathway enrichment analysis of EG. (A) The top 15 biological processes. (B) The top 15 cellular components. (C) The top 15 molecular functions. The colorful scales indicate the different thresholds for the p-values, and the lengths of the lines represent the number of genes corresponding to each term. (D) The cAMP signalling pathway. The large purple, red, and green rectangles on the left represent the key terms involved in the cAMP signalling pathway. The cAMP signalling pathway itself is in orange. The small green rectangles on the right represent the targets of the pathways themselves, and the blue represent the targets involved in these pathways in EG.