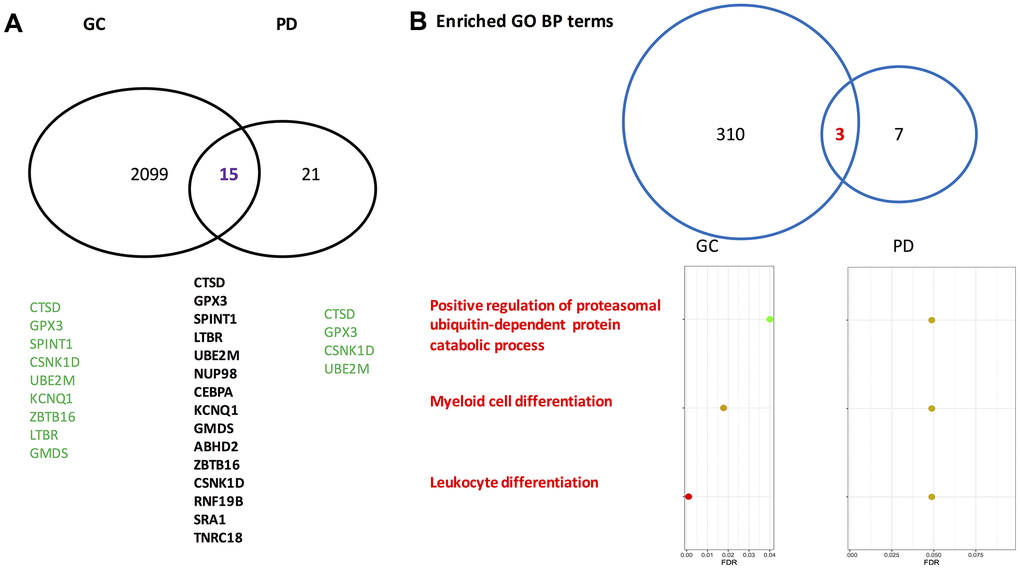
Figure 1.Venn-diagrams for differentially expressed genes identified by gastric cancer cohort and Parkinson’s disease cohort. (A) On the gene level. (B) On the level of enriched Gene Ontology annotation. PD, Parkinson’s disease; GC, gastric cancer; GO, gene ontology; BP, biological process. The gene symbols indicated by the GeneCards database to directly associate with gastric cancer and Parkinson’s disease are highlighted in green. Of note, on the gene level the overlapped rate of gastric cancer and Parkinson’s disease is significant according to a Fisher’s exact test (p=0.033).