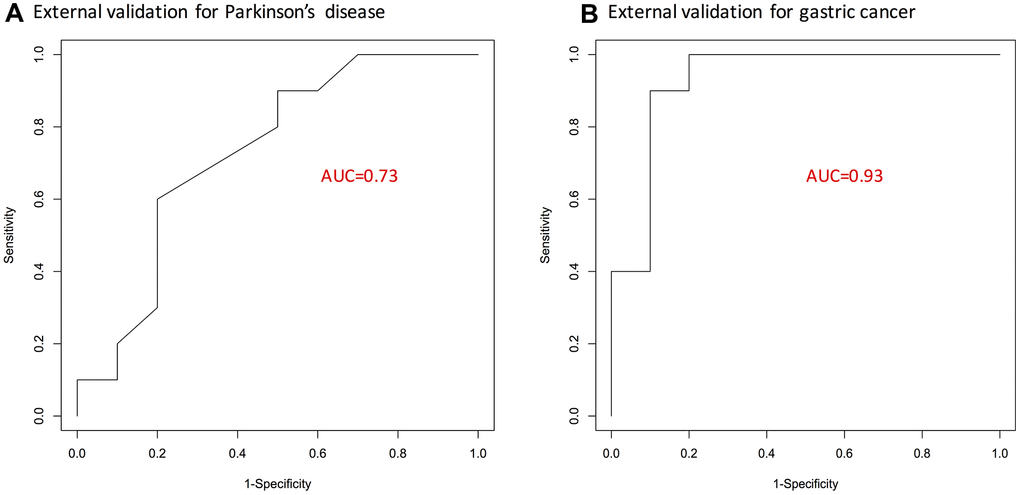
Figure 2.ROC curves showing predictive performance of the identified 15-gene signature. (A) For Parkinson’s disease. (B) For gastric cancer. Here, external validation sets were used. AUC, area under curve; GC, gastric cancer; PD, Parkinson’s disease.