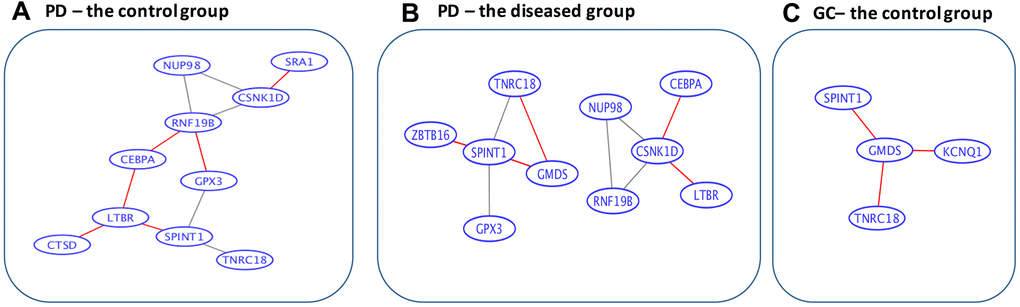
Figure 3.Data-driven gene-to-gene interaction networks of the overlapped 15 genes. (A) For the control group in Parkinson’s disease. (B) For the diseased group in Parkinson’s disease. (C) For the control group in gastric cancer. PD, Parkinson’s disease; GC, gastric cancer. The edges highlighted in red are unique for the corresponding categories. Specifically, among the gastric cancer patients, all the 15 overlapped genes are isolated from each other, whereas among the controls, 3 gene pairs (SPINT1 and GMDS, GMDS and TNRC18, and CSNK1D and RNF19B) are connected. In contrast, for Parkinson’s disease patients 5 pairs of connections are gained, 6 pairs are lost, while 5 pairs remain connected.