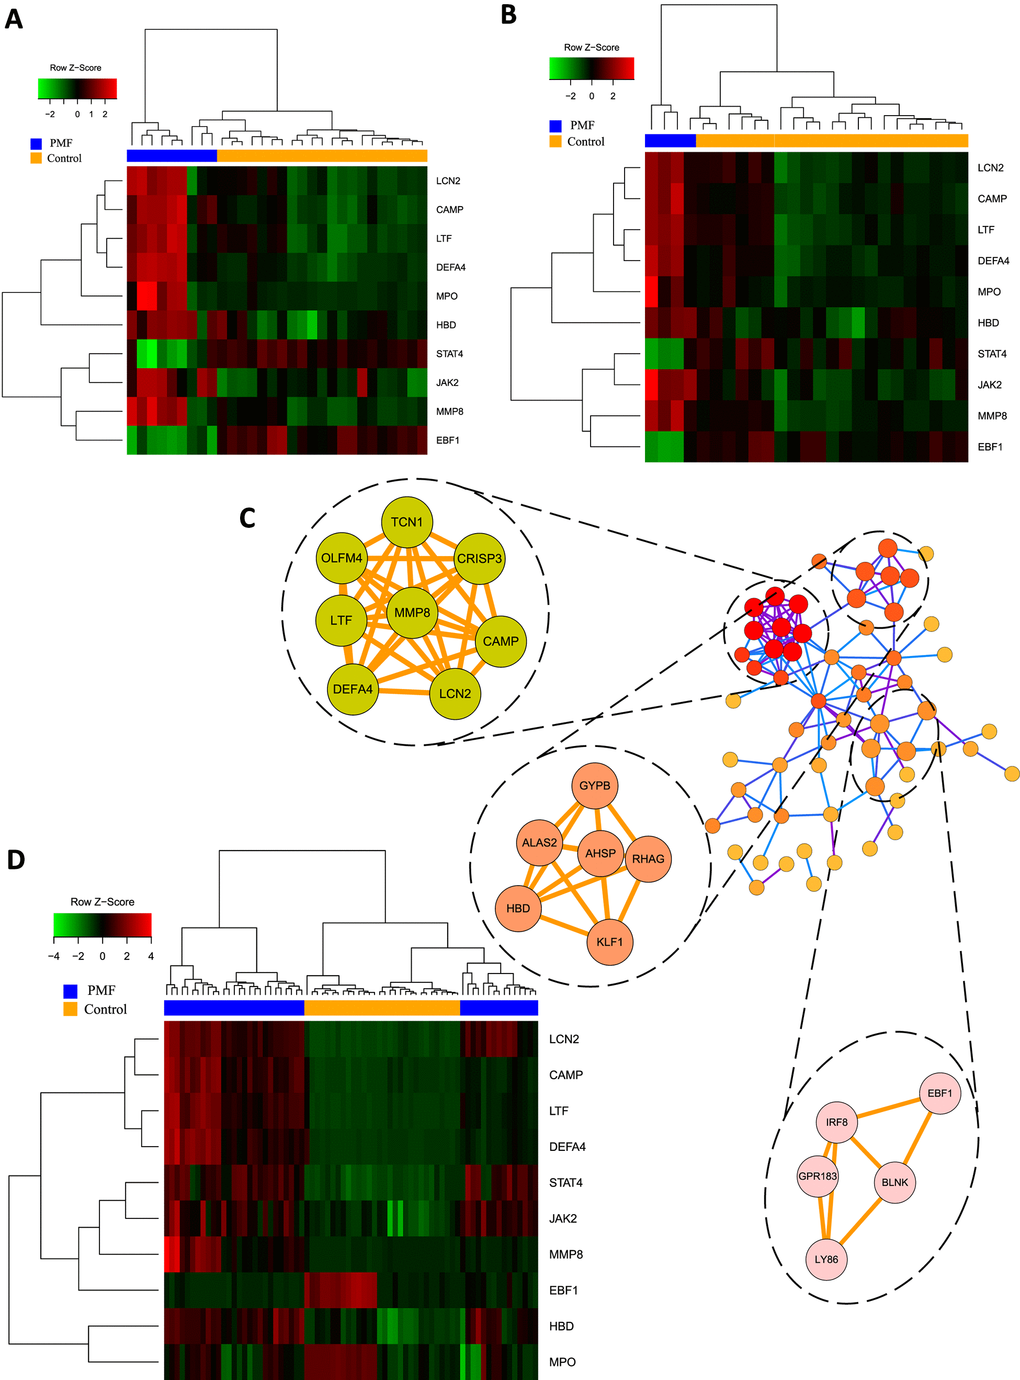
Figure 5.(A) Hub genes expression heatmap of GSE26049. (B) Hub genes expression heatmap of GSE61629. (C) Visualization of protein-protein interaction network and the top 3 modules from the PPI network. (D) Hub genes expression heatmap of GSE53482.
Figure 5 — Transcriptome profiling reveals target in primary myelofibrosis together with structural biology study on novel natural inhibitors regarding JAK2 | Aging