Submit an Article
Navigate
Home
Editorial Board
Editorial Policies
Current Volume
Archive
Scientific Integrity
Publication Ethics Statements
Interviews with Outstanding Authors
Newsroom
Sponsored Conferences
Podcast
Contact
Special Collections
Submit an Article
Online ISSN: 1945-4589
Research Paper
|
Volume 13, Issue 6
|
pp. 8306–8319
Identification of key genes in coronary artery disease: an integrative approach based on weighted gene co-expression network analysis and their correlation with immune infiltration
Back to article
Figure 1
(1 of 7)
−
100%
+
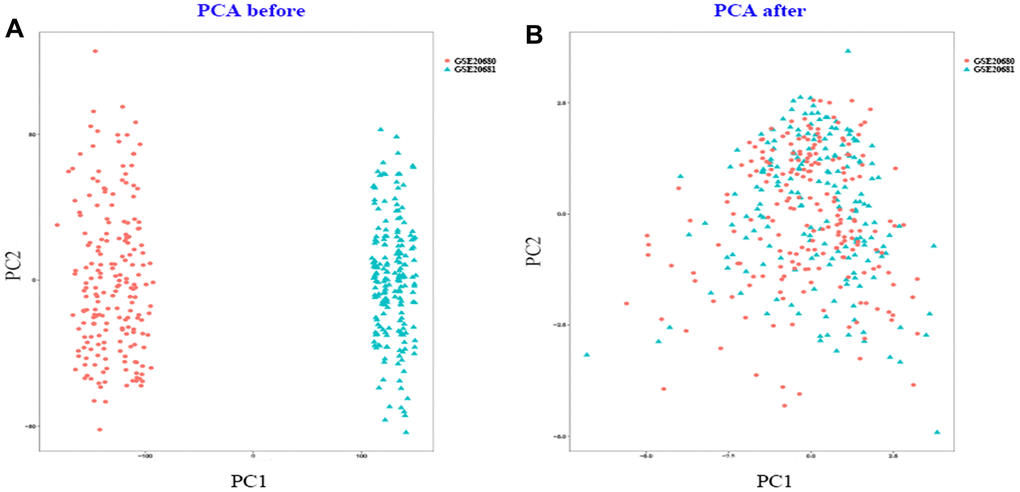
Figure 1.
PCA cluster plot.
(
A
) PCA cluster plot of GSE20680 and GSE20681 before sample correction and remove batch effect. (
B
) PCA cluster plot of GSE20680 and GSE20681 after sample correction and remove batch effect.