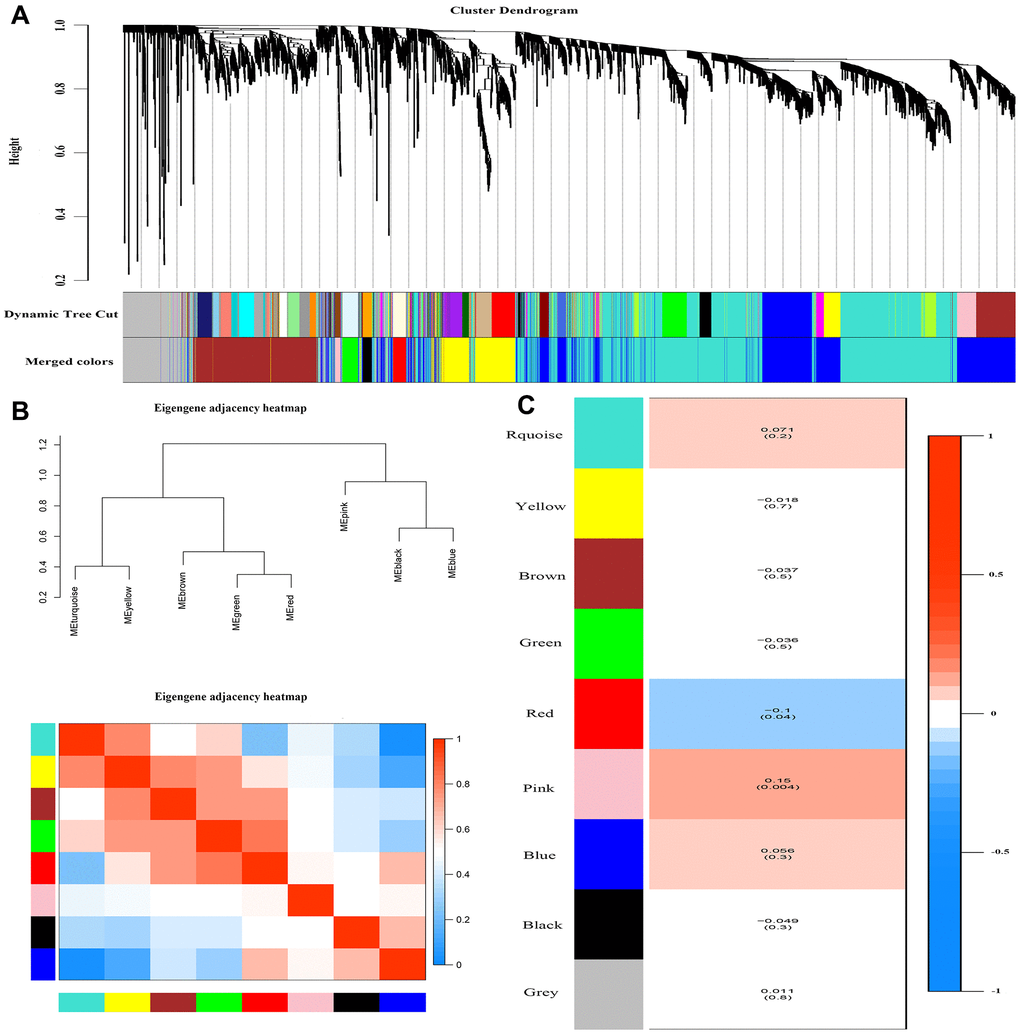
Figure 2.Weighted correlation network analysis. (A) Recognition module, each module was given an individual color as identifiers, including 8 different modules. (B) Co-expression similarity of entire modules based on hierarchical clustering of module eigengenes and the correlation between different modules, red indicates high adjacency (positive correlation) and blue low adjacency (negative correlation). (C) Correlation heat map of gene modules and phenotypes, the red is positively correlated with the phenotype; blue is negatively correlated with the phenotype.