Submit an Article
Navigate
Home
Editorial Board
Editorial Policies
Current Volume
Archive
Scientific Integrity
Publication Ethics Statements
Interviews with Outstanding Authors
Newsroom
Sponsored Conferences
Podcast
Contact
Special Collections
Submit an Article
Online ISSN: 1945-4589
Research Paper
|
Volume 13, Issue 6
|
pp. 8355–8368
90K predicts the prognosis of glioma patients and enhances tumor lysate-pulsed DC vaccine for immunotherapy of GBM
in vitro
Back to article
Figure 3
(3 of 7)
−
100%
+
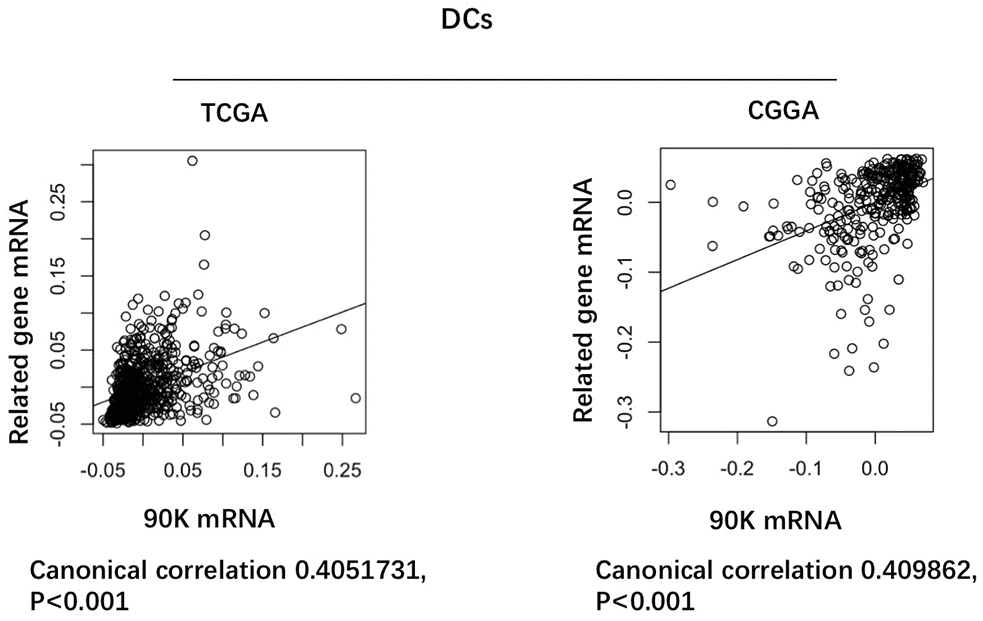
Figure 3.
Correlation of 90K expression with dendritic cell-specific marker genes in CGGA and TCGA datasets.
Each circle represents a patient with glioma.