Submit an Article
Navigate
Home
Editorial Board
Editorial Policies
Current Volume
Archive
Scientific Integrity
Publication Ethics Statements
Interviews with Outstanding Authors
Newsroom
Sponsored Conferences
Podcast
Contact
Special Collections
Submit an Article
Online ISSN: 1945-4589
Research Paper
|
Volume 13, Issue 3
|
pp. 3313–3341
Ageing transcriptome meta-analysis reveals similarities and differences between key mammalian tissues
Back to article
Figure 2
(2 of 2)
−
100%
+
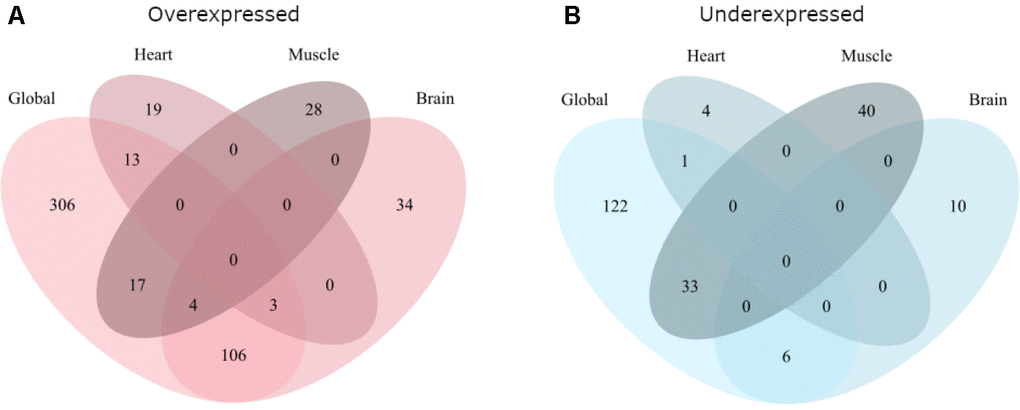
Figure 2.
Overlap of the global and tissue-specific results of this meta-analysis.
(
A
) Gives the overlap for genes overexpressed with age while (
B
) gives the overlap for genes underexpressed with age.