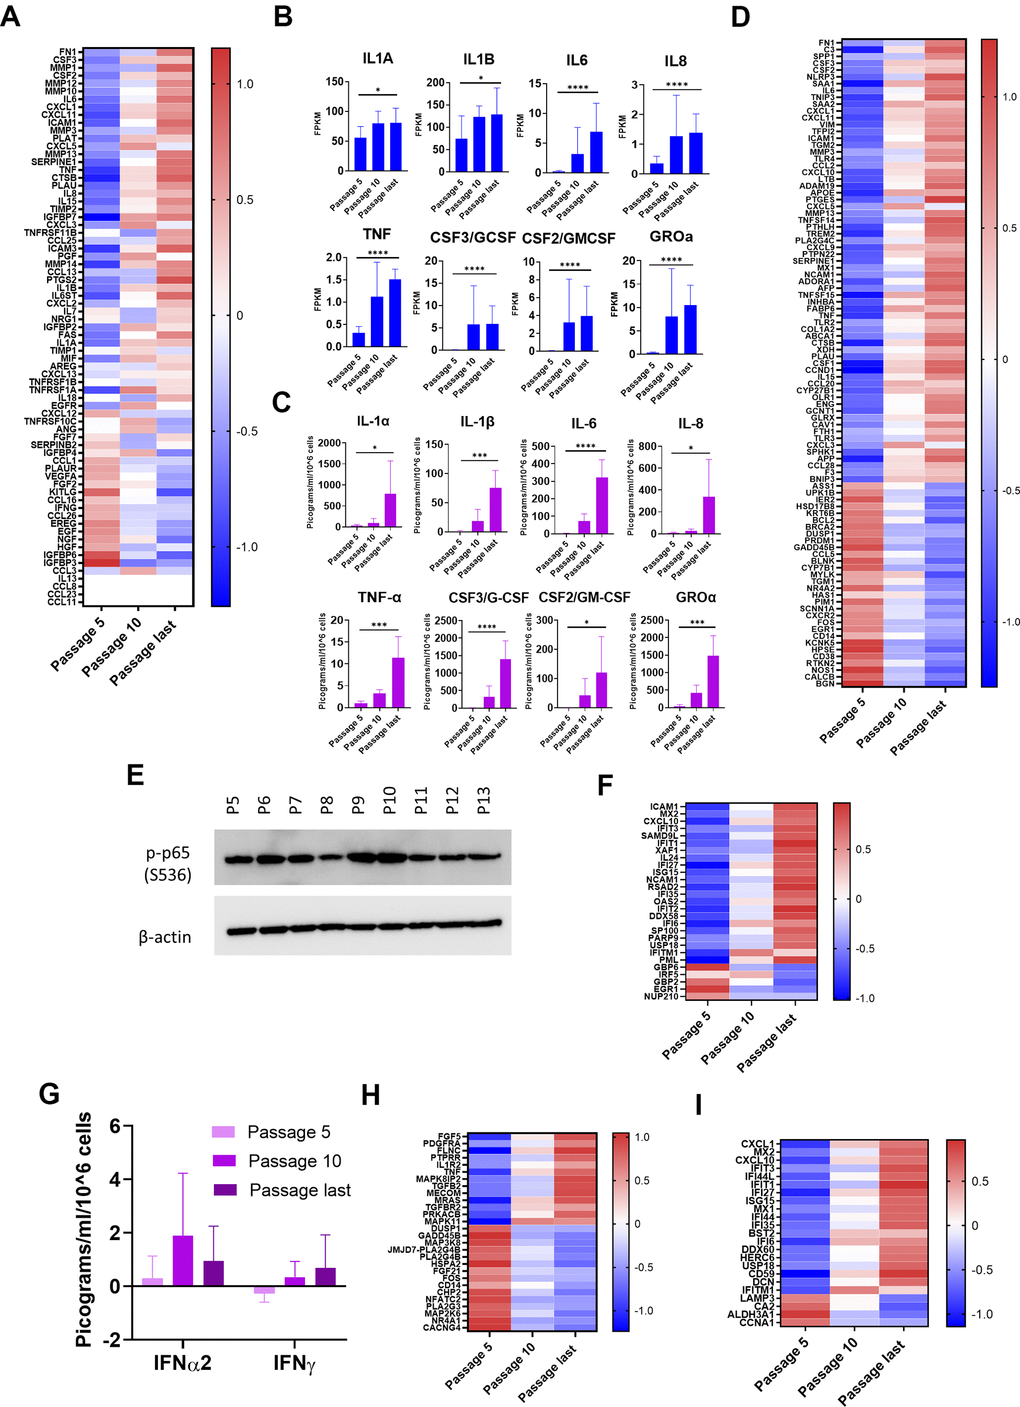
Figure 5.Inflammatory pathways upregulated with senescence. (A) Heat map of SASP protein components. Z-scores of changes in mRNA show upregulation, downregulation, or little change. Completely white rows represent zero FPKM at all passages for all donors. (B) mRNA levels of 8 selected major inflammatory SASP elements. Increases from passage 5 to last passage were significant (p < 0.05) (Mean ± SD). Y-axis scales differ. (C) Protein levels of the same 8 major inflammatory SASP elements in CM. Multiplex immunoassay results (Mean ± SD). Results normalized by cell count and by subtracting amounts of these proteins contained in the same quantity of clean medium. Y-axis scales differ. (Significance determined by t-tests.) (D) Heat map of differentially expressed genes (DEGs) in NF-κB pathways. Z-scores of mRNA changes. DEGs defined as adjusted p-value of change from passage 5 to last passage was < 0.05 and log2-fold change >1.5 or less than -1.5. (E) Immunoblot for p-p65 (S536). Indication of NF-κB transcriptional activity (Donor 1415). (F) Heat map of DEGs in IFN pathways. Z-scores of mRNA changes. DEGs defined as in Figure 5D. (G) IFN levels in CM are low at all stages. Determined and normalized as in Figure 5C. None of the changes were significant (p < 0.05). (H) Heat map of DEGs in p38MAPK pathways. Z-scores of mRNA changes. DEGs defined as in Figure 5D. (I) Heat map of IRDS DEGs. Z-scores of mRNA changes in IFN pro-survival gene set. DEGs defined as in Figure 5D. For Figure 5B, 5C, *p<0.05, **p<0.01, ***p<0.001, ****p<0.0001.